
 Zylo Ecosystem
 astronaut
 Pearl
Pearl Walrus
 Starknet
 Pudgy Penguins
 Bitcoin

Bitcoin (BTC) is at a critical stage, with analysts pointing to a short-term negative risk and the possibility of a bullish reversal. At press time, the cryptocurrency was consolidating within a narrow band, as both technical and liquidity structures indicated a potential retest of the lows before the next upward trend.
Bitcoin Price Forms Head-and-Shoulders Pattern
Analyst Ali noted a head-and-shoulders pattern forming on the daily chart, potentially indicating that the bullish momentum was waning. The setup’s left shoulder was near $114,000, the head around $125,000, and the right shoulder near $112,000. $100,000 served as the neckline, the most crucial support zone for this Bitcoin price structure.
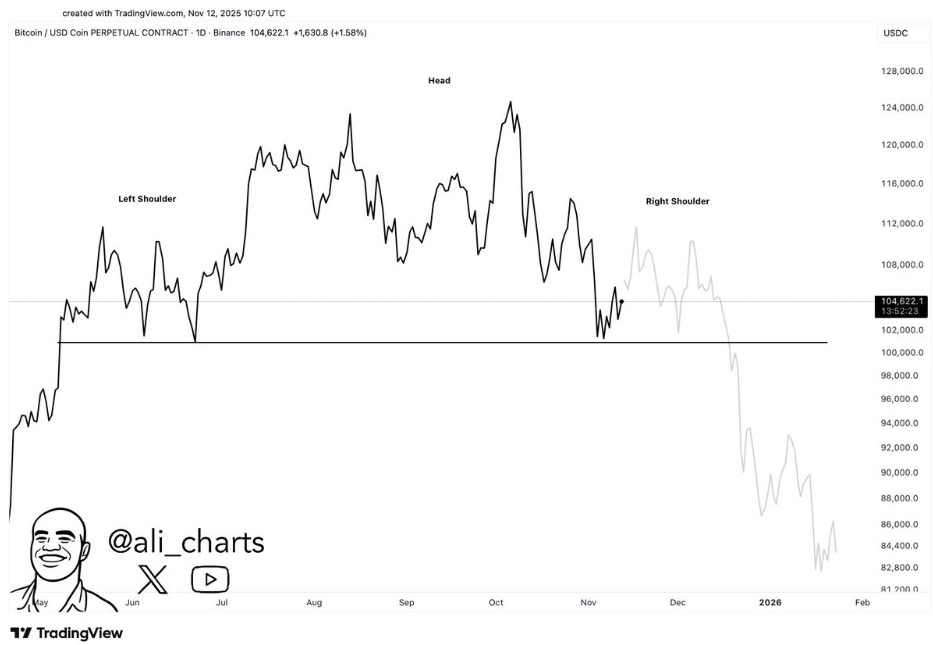
Trading at around $100,200 at press time, Bitcoin’s latest rebound coincided with the early stages of this right shoulder. Ali noted that a climb toward $112,000 could complete the formation before testing the neckline. The bearish setup would be confirmed by a breakdown and a daily close below $100,000, potentially leading to the $83,000 target as a key historical demand region.
Nonetheless, stability above $100,000 would preserve the overall bullish behavior. While short-term investors may view this setup as a sign of caution, long-term investors could take a dip toward support as an opportunity to accumulate strategically.
Analysts Eye Liquidity Deviation for Tactical Long Entries
Analyst Killa was monitoring the liquidity process of Bitcoin and identified a trading strategy between $96,000 and $104,000 after it fell to $106,000. Notably, the 96K-98K range was identified as a key liquidity pocket, as a deviation below the support would cause a market rebound after the sell-pressure exhaustion.
The analyst foresaw the swing-failure pattern (SFP) at around $97,000, a pattern that typically indicates seller fatigue before a sharp recovery. Once this lower liquidity is swept, Bitcoin could make a V-shaped rebound to $104,000.
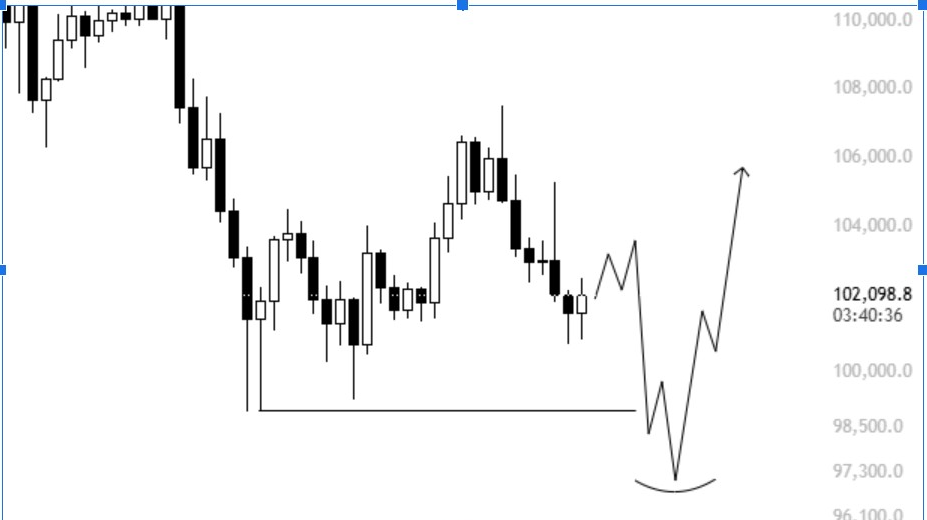
This strategy favors patience and precision as the analyst recommends trading when deviation and liquidity absorption are confirmed instead of trading in the range. Should such a move be followed by a price reclaim of the $100K level, Bitcoin could have found a short-term bottom and begin a local upswing. The inability to preserve this zone, however, would lead to further downside continuation.
Liquidity Heatmap Highlights Key Market Levels
Analyst BentoBoi provided more background with a Coinglass liquidity heatmap, which shows that there are strong sell walls at $112,000 and $114,000, with potential resistance at higher levels should Bitcoin move higher. Liquidity thinning out below $100,000 is a sign of weak buy support and a higher risk of sharp moves if the range is breached.
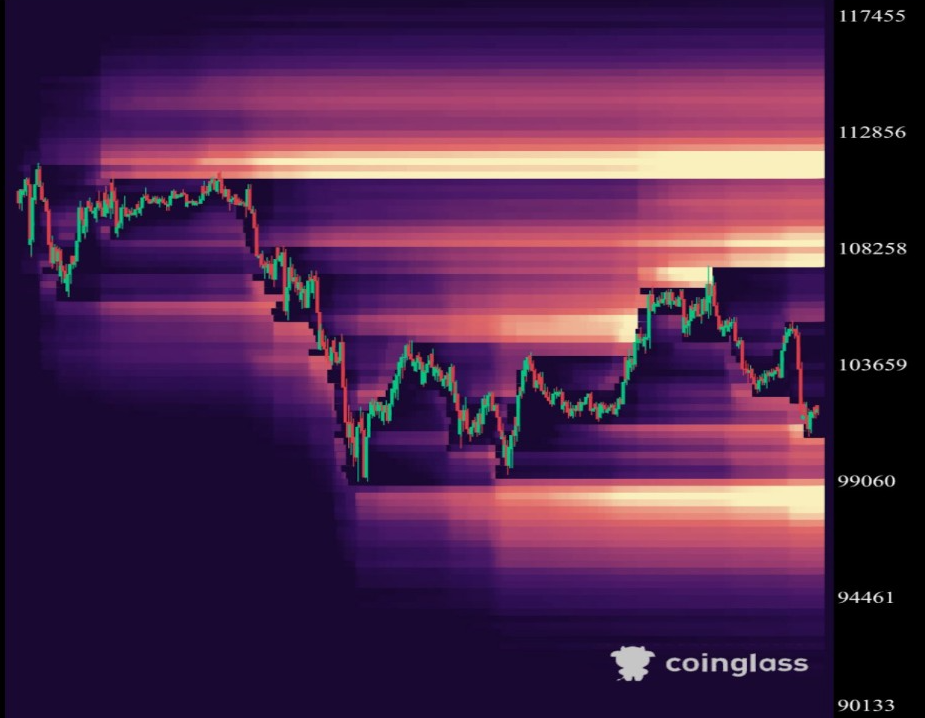
Moreover, the heatmap indicates that Bitcoin is currently in the range of $99,000-$108,000, with high liquidity activity in the $103,000 zone, which suggests an equilibrium between buyers and sellers. A breakout above $108,000 would reveal liquidity gaps to around $112K, thereby accelerating an upside momentum.
On the other hand, any break below $96,000 would lead to accelerated downfall because of the liquidity void below the existing levels. Overall, the structure is neutral to bullish, and liquidity concentrations are located above the spot price.
Falling Wedge Point to BTC Price Reversal
Complementing this view, BentoBoi also highlighted a falling wedge pattern. This is a common bullish reversal pattern, implying that Bitcoin could temporarily fall to around $97,000 and then break out. The action will probably be accompanied by short-term panic and compulsory liquidations, creating liquidity for institutional accumulation.
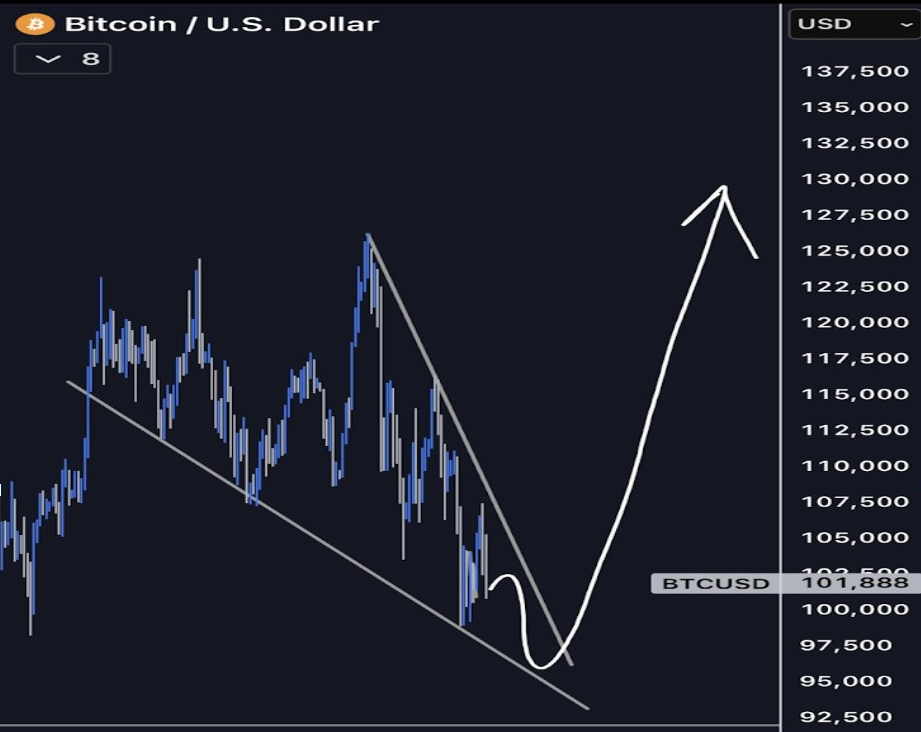
Moreover, a breakout of the wedge could push Bitcoin to the next major resistance levels of $125,000-$135,000. Historically, similar post-Death Cross arrangements have been followed by powerful recovery rallies, with Bitcoin developing higher lows before returning to its macro uptrend.
Bitcoin traded at approximately $101,000, above its crucial neckline of $100K at press time. Analysts suggest that despite short-term volatility and deeper corrections, any retest of the $83,000 zone could be the last pullback, followed by the next bullish run.



