Dacity Coin
 astronaut
 streamoors
 Celestia
 NeoSoul
 Sui
Sui Injective

Bitcoin price faced its harshest drawdown of this bull cycle as on-chain losses surged. At the same time, BTC again pressed against the $92,000 resistance zone.
The decline inflicted deeper financial pain on holders than earlier pullbacks. Price action signaled renewed attempts to move higher.
Bitcoin price story mattered because it tested whether this bull cycle still retained structural strength. On-chain metrics showed rising stress among short-term holders and newer whales.
On the other hand, traders watched whether Bitcoin could reclaim a level that had already been rejected several times.
On-chain Data Showed Record Losses During the Latest Bitcoin Price Drop
On-chain indicators showed the most severe realized losses of the cycle during the latest Bitcoin price decline. Realized Loss in U.S. dollar terms reached $5.8 billion, according to data compiled using metrics by Julio Moreno of CryptoQuant.
That figure exceeded the $2.9 billion and $2.3 billion recorded during the first and second pullbacks.
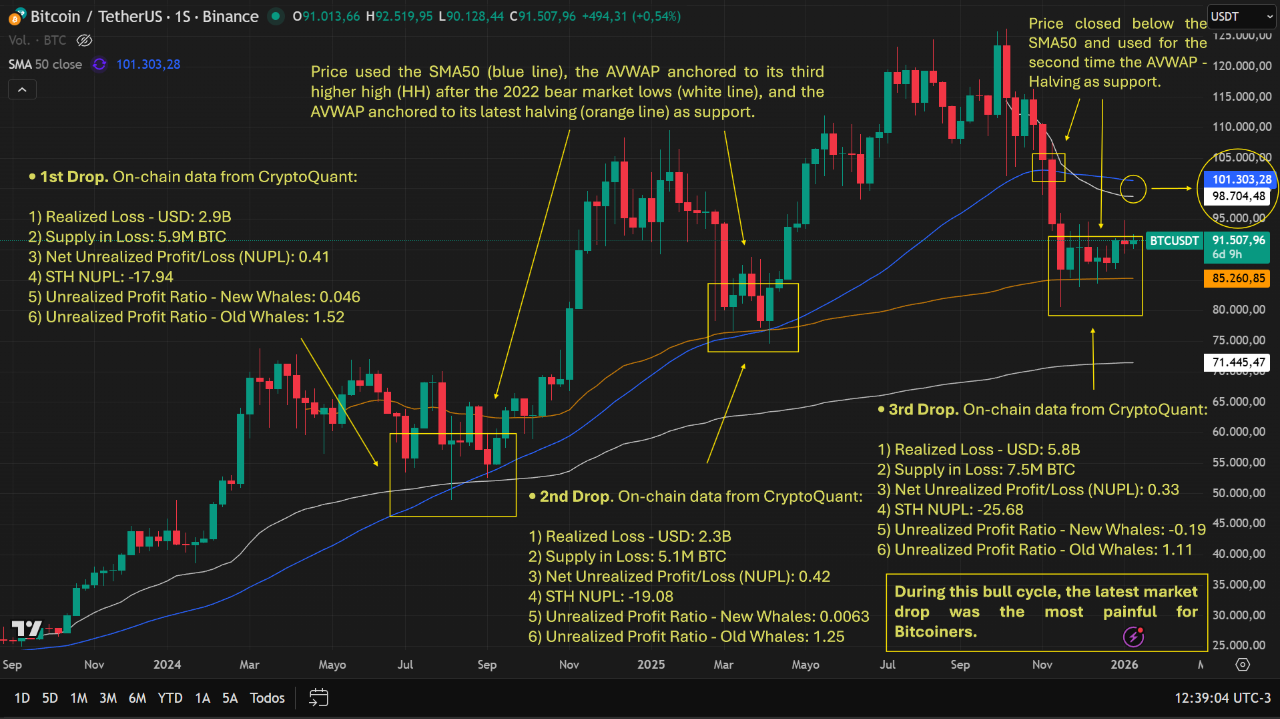
Supply in Loss climbed to 7.5 million BTC, around 50% higher than the prior decline and roughly 30% above the first drop. The data showed a larger share of circulating supply sitting below its acquisition price, increasing psychological pressure on holders. These conditions marked the most intense pain phase so far in this cycle.
Net Unrealized Profit/Loss fell to 0.33, down from 0.41 and 0.42 during earlier corrections. The metric still remained positive, indicating the market had not entered aggregate unrealized loss.
However, shrinking unrealized gains suggested reduced tolerance for further downside among investors.
Short-term Holders Absorbed Deeper Damage Than Earlier Pullbacks
Short-term holder behavior reflected the sharp rise in stress during the decline. Short-Term Holder Net Unrealized Profit/Loss dropped to -25.68, compared with -17.94 and -19.08 in previous corrections. That shift showed recent buyers bore the heaviest losses as the price retraced.
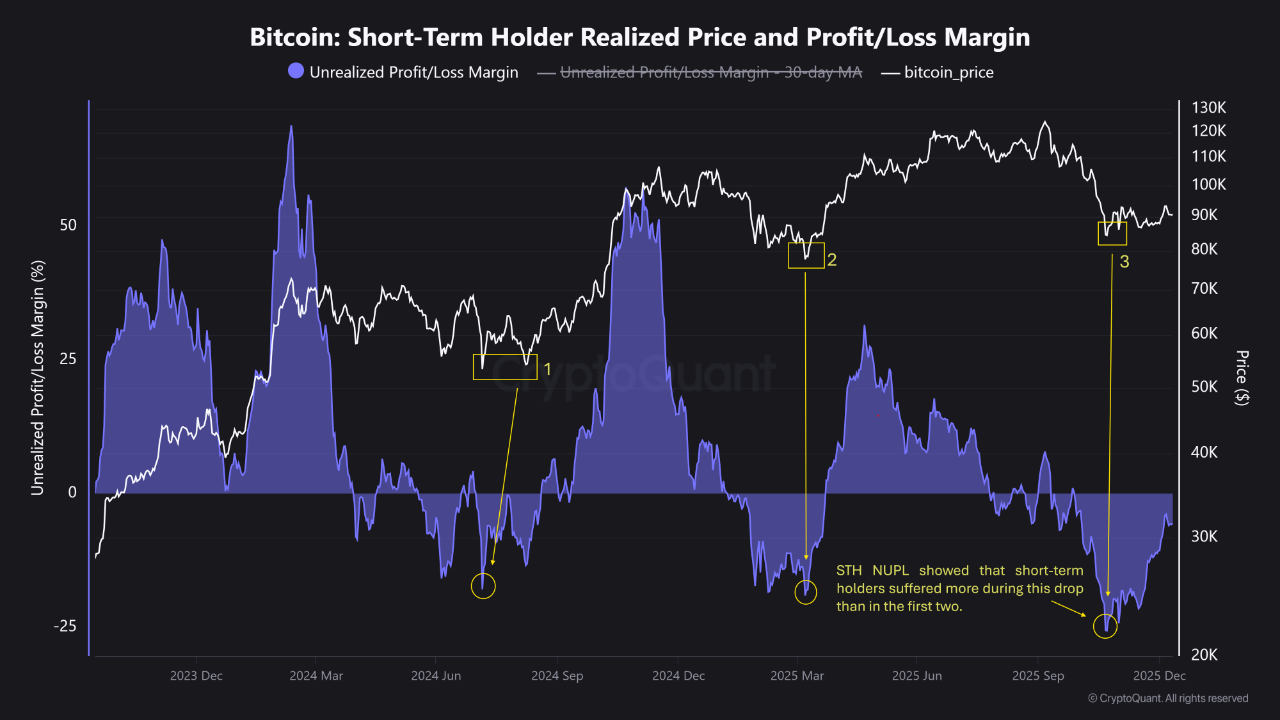
Data by Julio Moreno highlighted that each successive drawdown transferred more losses onto newer market participants.
The pattern suggested increasing fragility among short-term holders, who typically act as marginal sellers during volatility. That behavior amplified downside momentum during the decline.
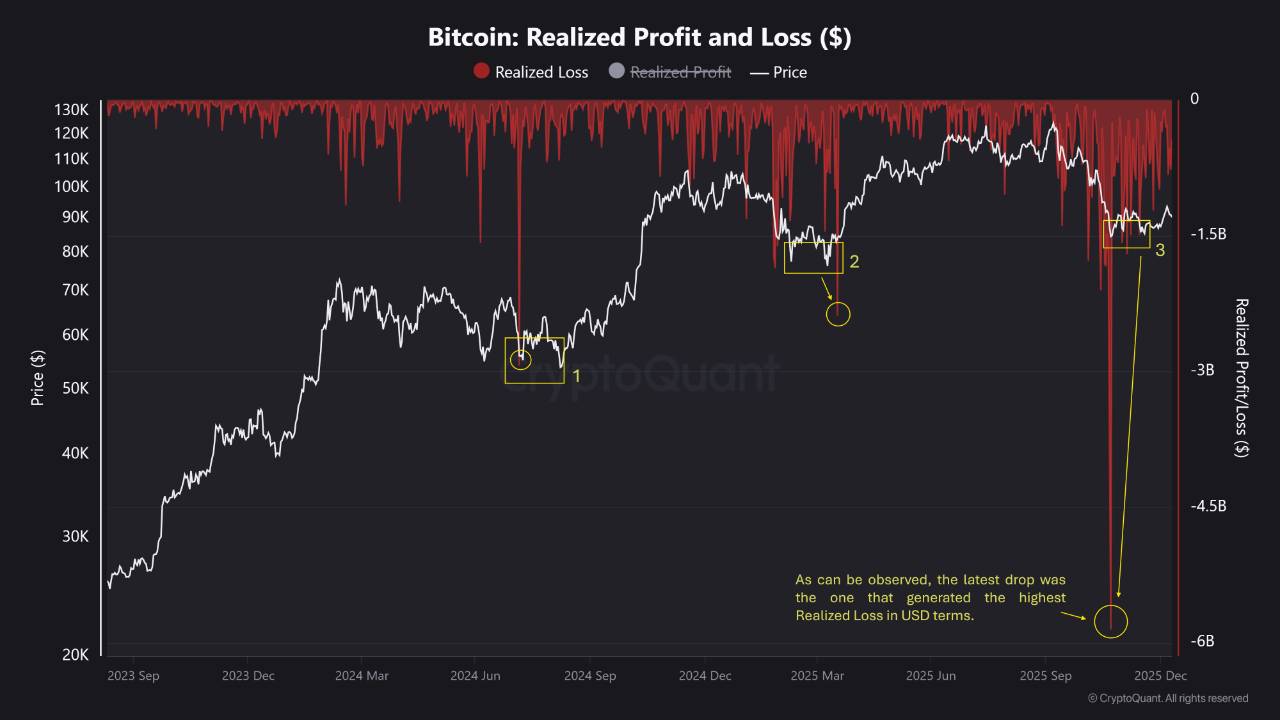
Despite the pressure, the data did not show full capitulation. Supply in loss rose sharply, yet aggregate NUPL remained above zero. That balance indicated broad profitability persisted, even as short-term sentiment deteriorated.
New Whales Slipped into Unrealized Losses for the First Time this Cycle
The latest drawdown also marked a structural shift among large holders. The Unrealized Profit Ratio for New Whales dropped to -0.19.
That pushed this cohort into net unrealized loss territory for the first time this cycle. Ki Young Ju, CryptoQuant CEO, previously noted this ratio tracked profitability differences between newer and older large holders.
At the same time, the Unrealized Profit Ratio for Old Whales fell to 1.11, down from 1.52 during the first pullback.
The last instance when both ratios compressed this sharply after an all-time high occurred in May 2022. That historical parallel highlighted how much profit compression occurred across large holders.
The data suggested profit buffers among newer whales eroded faster than among long-term holders.
Older whales still held sizable unrealized gains, though shrinking ratios reduced their incentive to distribute aggressively. This divergence shaped market supply dynamics during the recovery attempt.
Bitcoin Price Approached the $92,000 Resistance Zone Again
As on-chain stress peaked, Bitcoin price rebounded toward a familiar technical ceiling. Analyst Ted Pillows said Bitcoin moved toward the $92,000 resistance zone again.
He called it the eighth or ninth attempt to reclaim that level. Repeated failures previously pushed price back into a narrow range.
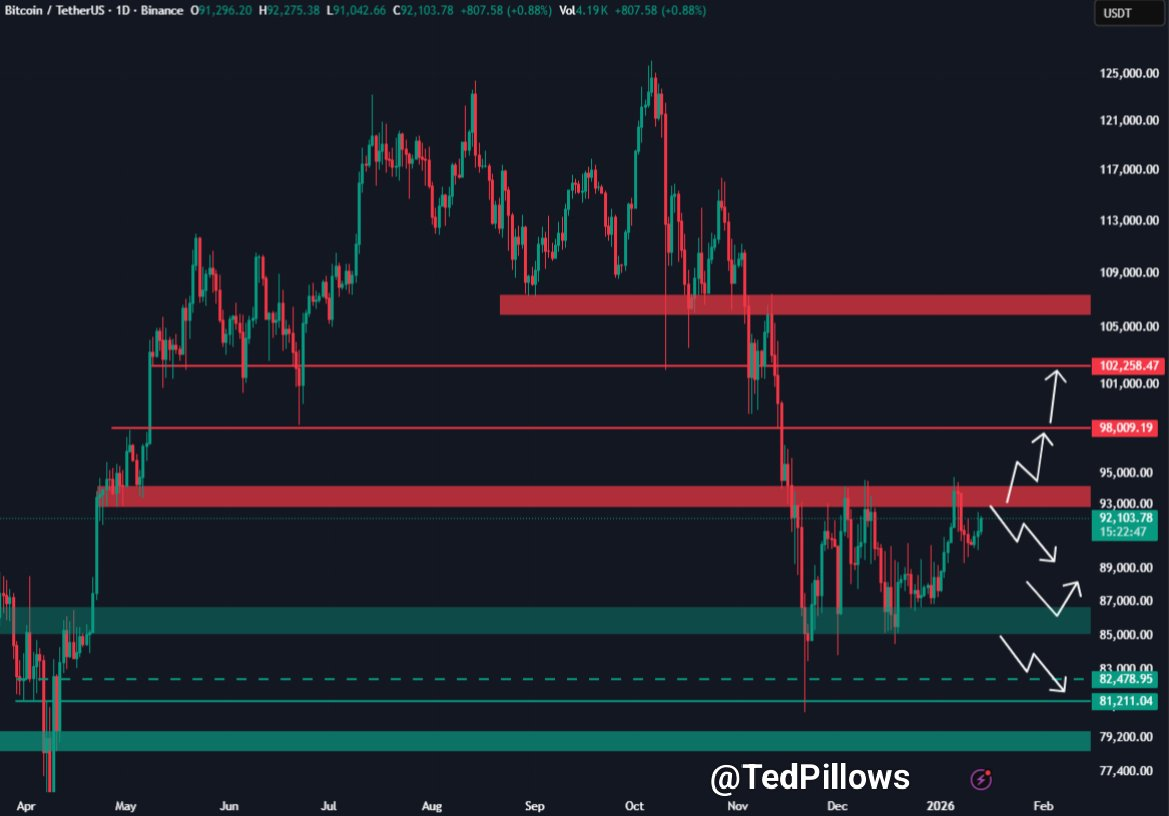
Pillows warned another rejection could turn Bitcoin into a $90,000 stablecoin. This reflects prolonged consolidation rather than directional movement. The repeated tests underscored how supply continued to emerge near resistance, despite improving short-term momentum.
This price behavior aligned with on-chain signals showing cautious recovery rather than aggressive accumulation. Realized losses peaked, but follow-through buying remained measured. Traders watched whether absorption near resistance improved compared with earlier attempts.
Technical Structure Reflected Recovery Attempts, Not Trend Confirmation
Daily chart data showed Bitcoin price rebounded above $92,000. At the same time, it remained below key moving averages near the mid-$90,000s. Trend overlays indicated declining resistance from prior highs, with price still below longer-term averages that capped rallies.
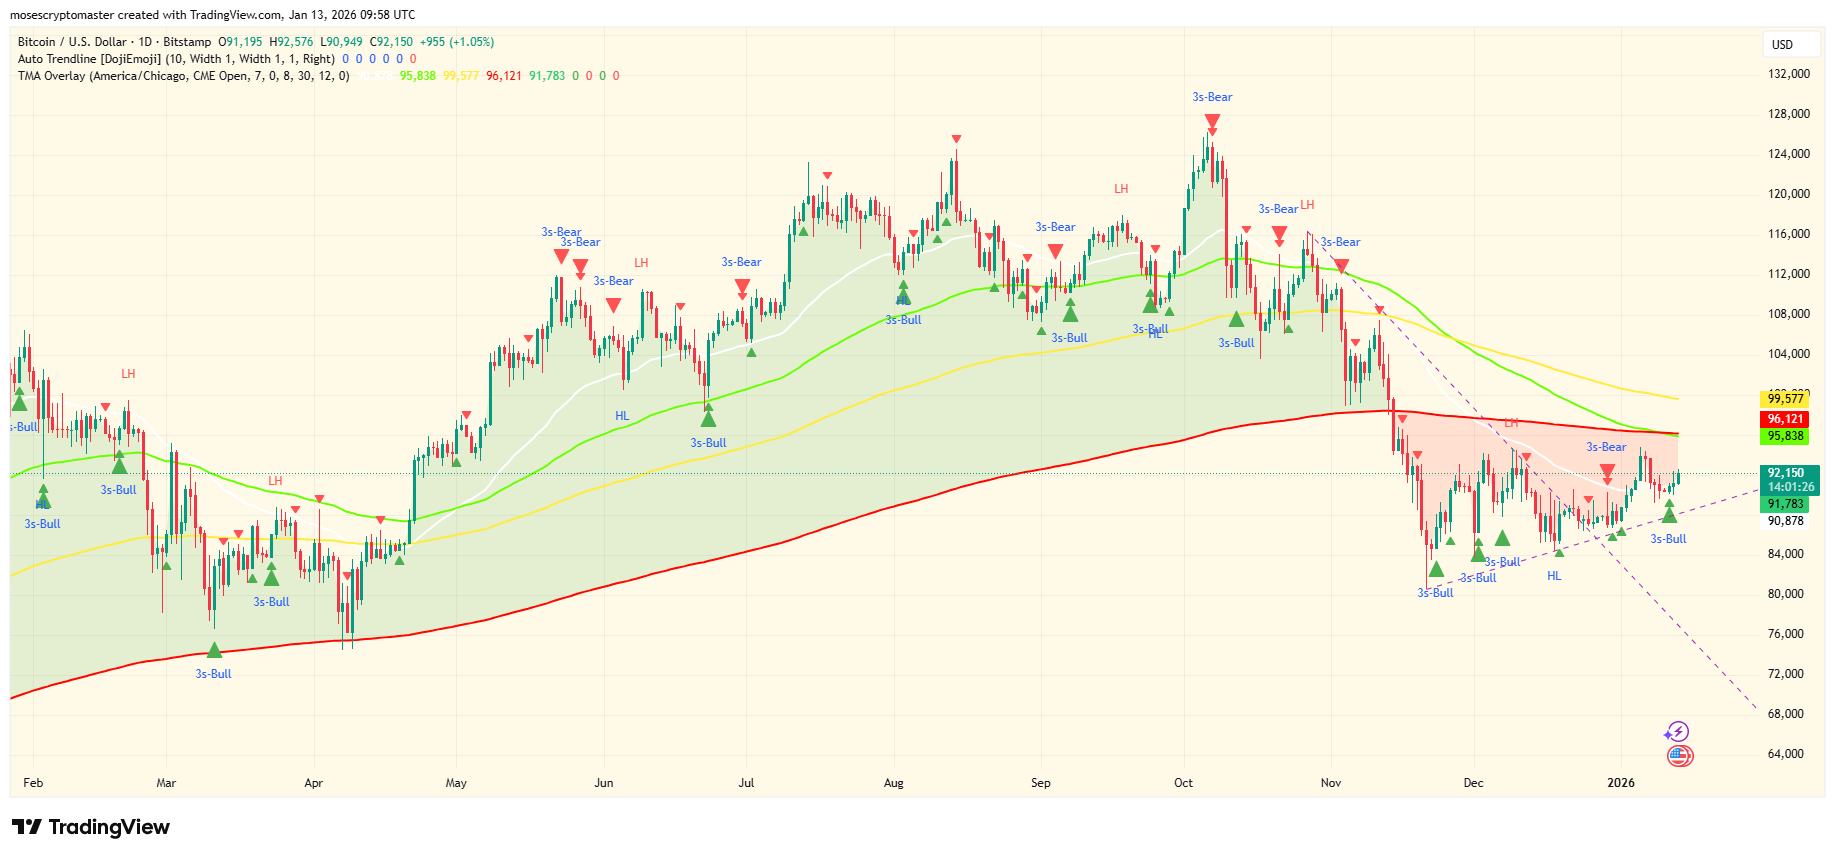
The structure suggested Bitcoin attempted to form higher lows after the December bottom. However, confirmation remained absent. Previous rallies stalled near similar zones before rolling over. That pattern reinforced why traders treated the current move with caution.
Bitcoin’s market focus is on sustaining closes above $92,000 while eyeing resistance levels near $95,000–$96,000. A decisive move could set the tone for the next trend. Failure to hold could invite renewed tests of the $90,000 area, where buyers previously stepped in.
What Comes Next for Bitcoin Price After Peak On-chain Pain
The data showed this pullback inflicted the deepest financial pain of the bull cycle so far. Realized losses, rising supply in losses, and stressed short-term holders defined the drawdown. New whales entering unrealized losses added another layer of vulnerability.
At the same time, the Bitcoin price continued pressing resistance rather than collapsing. That behavior suggested selling pressure may have already peaked. The immediate focus remained on whether BTC could convert $92,000 into support and mitigate the risk of repeated rejection.
If the price held above that level, attention shifted toward higher resistance near $96,000. Another failure, however, kept the risk of prolonged consolidation near $90,000 firmly in play.