Puffer
 Bitcoin
 ZKsync
 NEAR Protocol
 Walrus
 Pearl
Pearl Ondo
Ondo

Dogecoin price is trading near the critical support areas. With this, several analysts are pointing to developing reversal structures.
Recent charts revealed buyers defending lower levels and testing nearby resistance. Meanwhile, investors are anticipating confirmation signals before the next move in either direction.
Dogecoin Price Forms Double Bottom on Lower Timeframes
DOGE price on the four-hour chart displayed a clear double bottom structure, pointed out by Trader Tardigrade. There were two similar lows near the $0.136 to $0.138 region. Buyers stepped in twice and invented a rounded bottom.
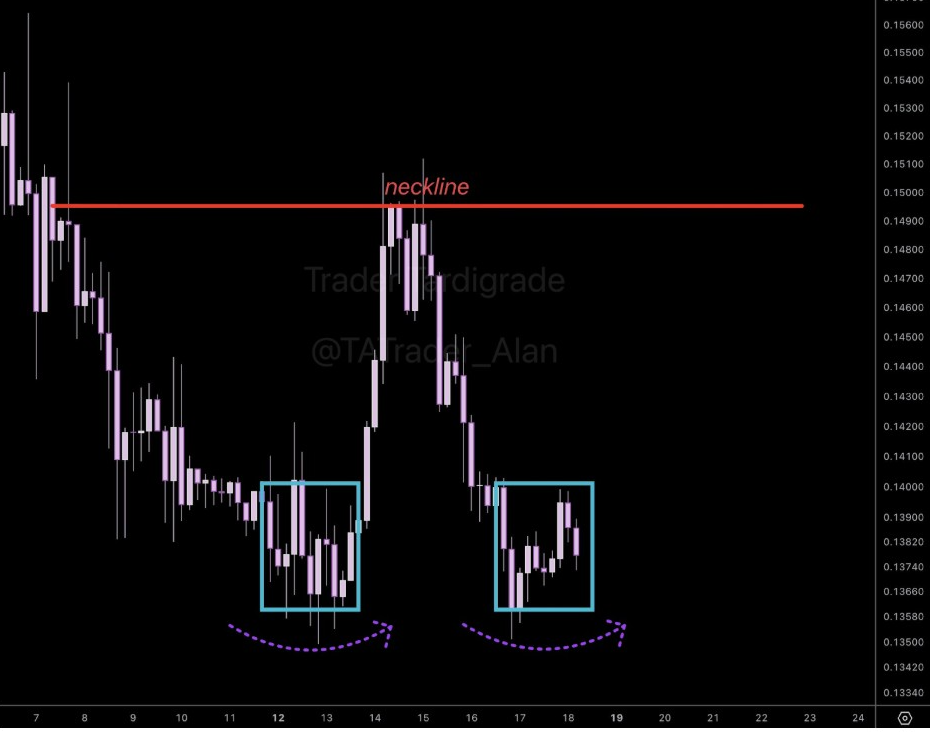
The neckline for this pattern is near the $0.148 to $0.150 zone. Dogecoin price recently approached but could not get a decisive breakout. A sustained close above this area would confirm the reversal structure.
Volume during the second bottom was steady. This behavior is often an indication of decreased selling pressure. The activity of buyers is seen to be more around support zones.
Short-term momentum candles also display tighter ranges. That compression is usually followed by directional expansion. Traders now watch the price behavior at the neckline area.
Support Levels Define Near-Term Risk Zones
Another chart shared by Man of Bitcoin pointed out critical levels of downside. The analysis revealed good support around $0.1232. A deeper break below $0.1154 would be further downside risk.
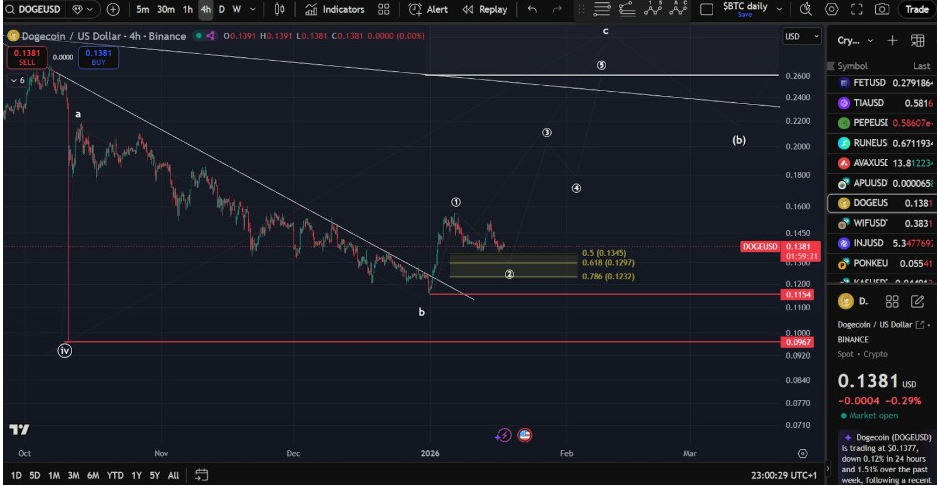
DOGE price is currently trading above these supports. Holding above $0.1232 keeps intact the bullish recovery structure. Losing this level could turn the tide back in favor of sellers.
There were also Fibonacci retracement zones in the chart around $0.1297 and $0.1345. These levels are now intermediate reaction points. Dogecoin price consolidation around them is a sign of indecision.
Traders are still looking for higher lows above these zones. That structure would strengthen short-term bullish control. Failure could be an invitation for renewed selling pressure.
Long Term Range Demonstrates Resistance Zone
Weekly charts shared by ConquererCrypto pointed to a long-standing horizontal resistance band. This zone is close to $0.149 to $0.150. Dogecoin price previously struggled to hold above this level.
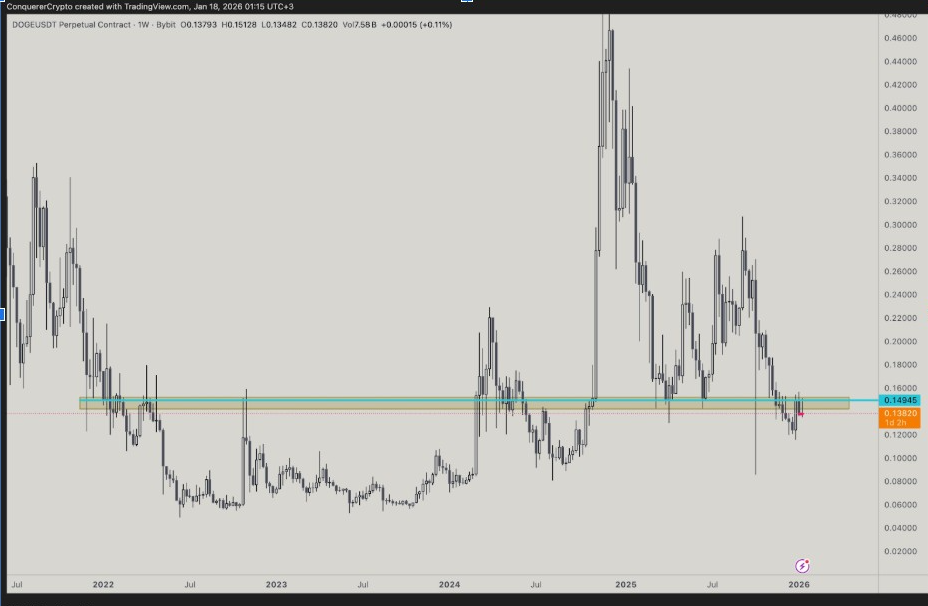
The chart showed repetitive rejections around this resistance area. Each attempt resulted in pullbacks towards low consolidation zones. This behavior is one of strong overhead supply.
However, price is now trading close to this zone again. Repeated testing can cause weakening of resistance over time. A confirmed breakout would be a shift in structure.
Support on this upper timeframe seems to be near the $0.138 region. This area presently functions as a pivot area. Supporting it is a bullish continuation attempt.
Chart Targets Highlight Upside Potential for Dogecoin Price
Another weekly chart that was shared by Hailey LUNC focused on historical breakout projections. The chart is showing long-term resistance near the $0.50 to $0.65 range. These levels are in line with previous highs for the cycle.
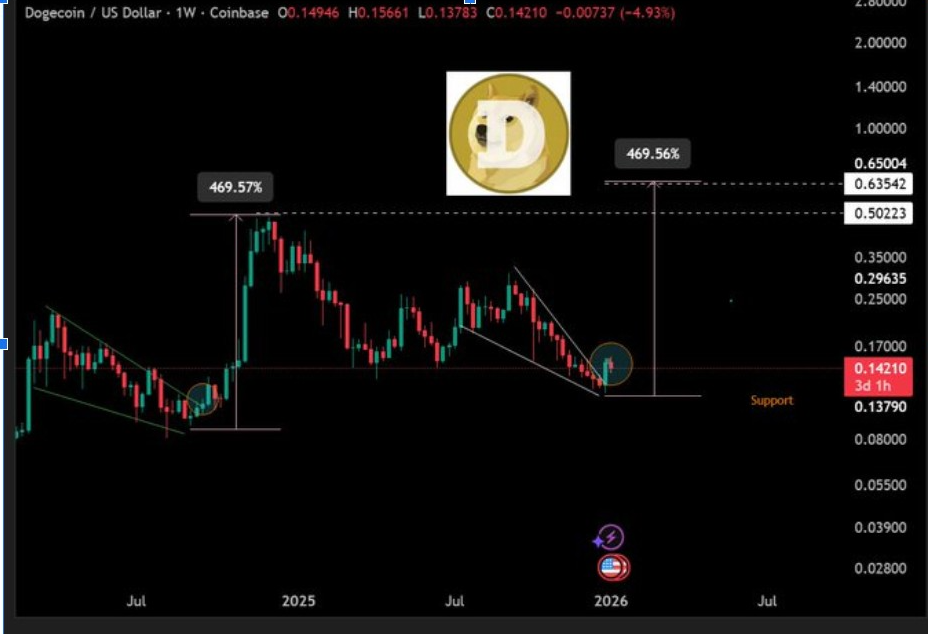
In the current Dogecoin structure, the price is far below those regions. The chart implies that if the trend reversals were sustained, they could open roads to higher resistance zones. However, there isn’t yet any breakout confirmation.
The analysis also has current support near $0.142 and $0.137. These levels remain acting as near-term demand zones. Buyers held on to these areas during recent retracements.
Momentum indicators on the weekly timeframe indicate price stabilizing after long declines. This behavior is often followed by longer periods of consolidation. Traders are very careful when they wait for confirmation.
Dogecoin price is currently trading close to $0.138 with continued consolidation taking place. Key resistance is near $0.150, while support is near $0.123 & $0.136. Short-term breakout confirmation is achieved on the basis of volume expansion and sustained closes above resistance.