Wisp
Wisp Identity.md 6900
 Bunker Mode
 Crawlerpad
 Claudia
 Pearl
Pearl NEAR Protocol

Dogecoin price is displaying early signs of strength after holding above critical levels of support in multiple timeframes. Recent charts show improving structure, and traders keep an eye on whether momentum can continue to build. Analysts are now watching closely as technical formations begin to align.
Dogecoin Price Holds Key Channel Level
Dogecoin price has broken out of a long-running descending channel on the weekly chart. This structure had been taking prices lower since late 2023. The recent weekly close above the channel suggests selling pressure is easing.
Market analyst Trader Tardigrade pointed out that DOGE candles are now outside the previous range to the downside. This change is often a transition phase and not an immediate rally. Still, prolonged closures above the channel enhance the likelihood of trend stabilization.
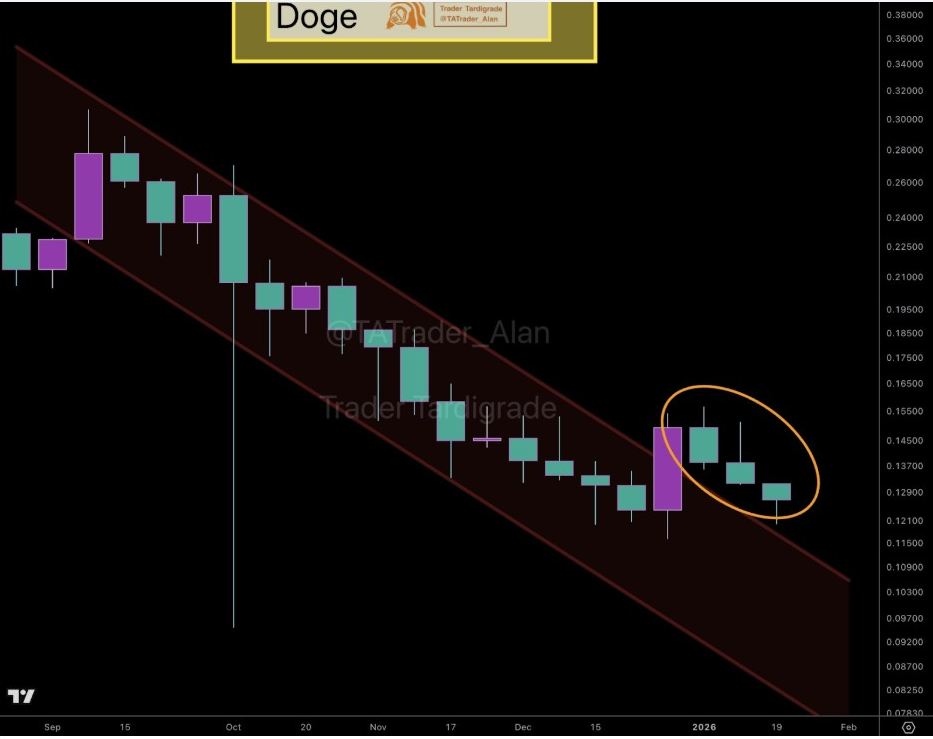
At the same time, Dogecoin price is still below major historical resistance zones. This positioning keeps the setup cautious rather than aggressive. However, reclaiming the channel is widely considered a first step in trend recovery.
Volume has been moderate in this move, which is supportive of a controlled breakout. Sudden spikes might result in volatility. For now, DOGE price trend points to steady accumulation rather than speculative excess.
DOGE Bull Pennant Signals Compression Phase
On lower timeframes, the Dogecoin price has formed a nice bull pennant. This pattern followed a strong intraday advance. DOGE price then consolidated within a tightening range.
Trader Tardigrade posted hourly charts of compression near the pennant apex. The continuation of such formations often occurs through volume expansion. A confirmed breakout would need the price to move decisively above the upper trendline.
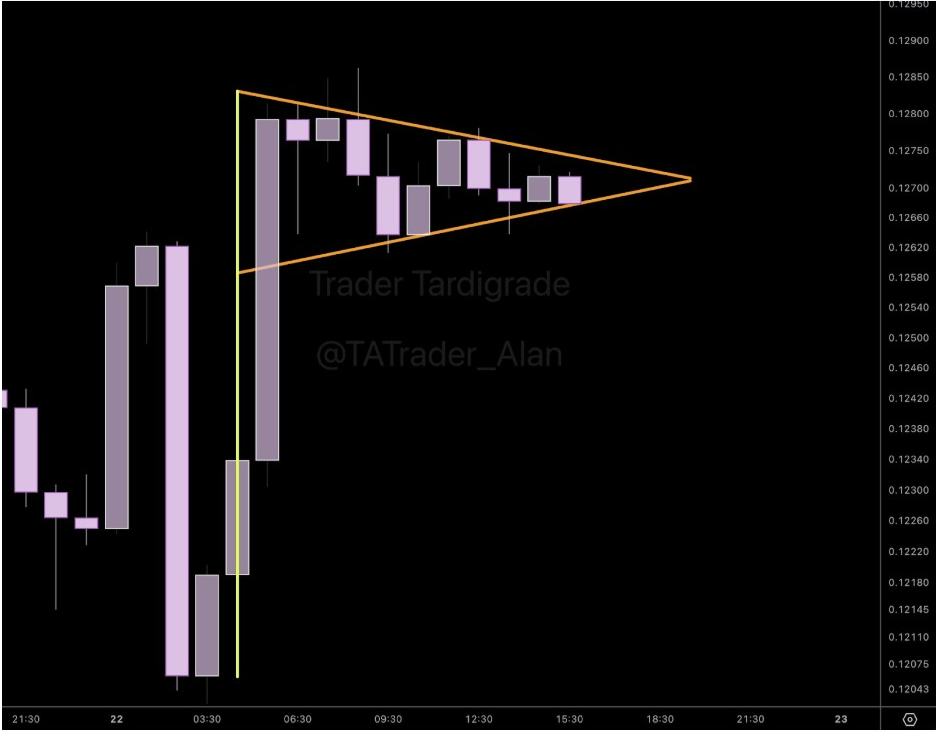
For now, candles are still in order with higher lows forming within the structure. This trend is a reflection of the balance between buyers and sellers. A breakdown below the lower boundary would weaken the short-term bullish case.
Importantly, this pattern aligns with the higher-timeframe channel breakout. When more than one timeframe is in agreement with the same direction, the probabilities are often better. Traders are still monitoring the $0.13 area as a near-term decision area.
Mini Cycle Structure Draws Attention
Looking at the larger picture, Dogecoin price is following a familiar cyclical pattern. According to analysis shared by Bitcoinsensus, DOGE has had three large accumulation phases in the past. Bigger DOGE price rallies preceded each phase.
The first rally achieved gains of almost 190%. The second rally blew up to about 480%. The current structure looks like a third accumulation zone, which may set the stage for another 450% expansion.
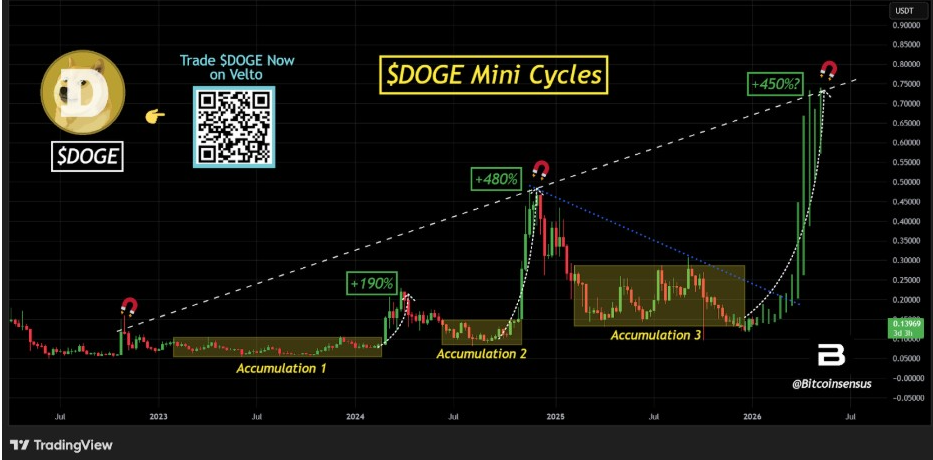
Charts indicate extended periods of sideways movement, followed by sharp upside breaks. Dogecoin price is currently trading in such a range. This behavior is suggestive of patient positioning and not panic selling.
That said, the cycle-based analysis is quite dependent on historical repetition. Market conditions are never the same. Still, many traders use these comparisons to frame expectations and manage risk over longer horizons.
Momentum Indicators Hint at Next Move
Furthermore, additional confirmation comes from long-term indicators highlighted by analyst CryptoSurf. He noted that Dogecoin price continues to show respect to the 200-week moving average. This level has previously served as a significant support area.
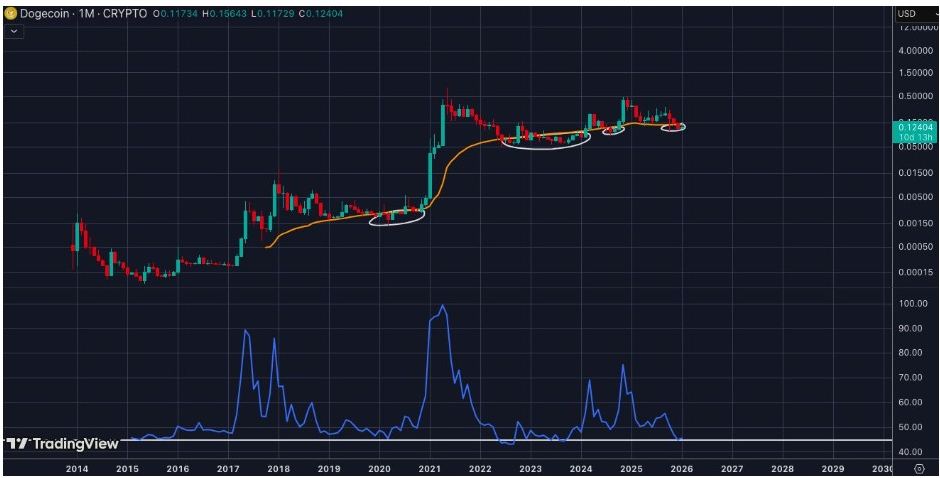
Strong multi-month advances often followed previous contacts with the 200-week average. DOGE holding near this level is suggestive of a potential limited downside risk. However, it takes momentum to build back up slowly on the upside.
Monthly charts also indicated DOGE consolidating above previous cycle lows. This is the structure of a market that absorbs supply without breaking down. Volatility has been compressed, which often precedes directional moves.
CryptoSurf also indicated momentum oscillators resetting from high levels. This reset reduces the risk of overheating. As a result, the Dogecoin price may be forming a stronger base than previous speculative peaks.