
 Doge Pepe
 Optimism
 Pearl
Pearl Quantus
 Bitway
 Pons
Pons NEAR Protocol

Dogecoin price weekly chart is in focus as analysts map setups based on weekly closes. Trader Tardigrade and Ali Charts posted updates that track a repeating cycle structure and a tightening wedge. Both views keep the $0.13 area as the support line to watch before any breakout attempt in early 2026.
The latest Dogecoin price prediction also connects near-term targets with wider cycle projections into 2026. The charts stress confirmation through weekly closes, not quick moves inside the week. In this Dogecoin price prediction view, the first upside levels sit at $0.19 and $0.36, with $0.80 marked as a higher objective if the wedge breaks upward on strong weekly closes.
Dogecoin Price Prediction: Weekly Cycle Model Shows a New Turn
Trader Tardigrade’s weekly chart frames Dogecoin price as a repeating cycle market. The chart showed a sharp 2021 peak, followed by a multi-year decline that transitions into a broad base. The analyst arcs outline rounded bottom phases that appeared before earlier reversals on the same timeframe.
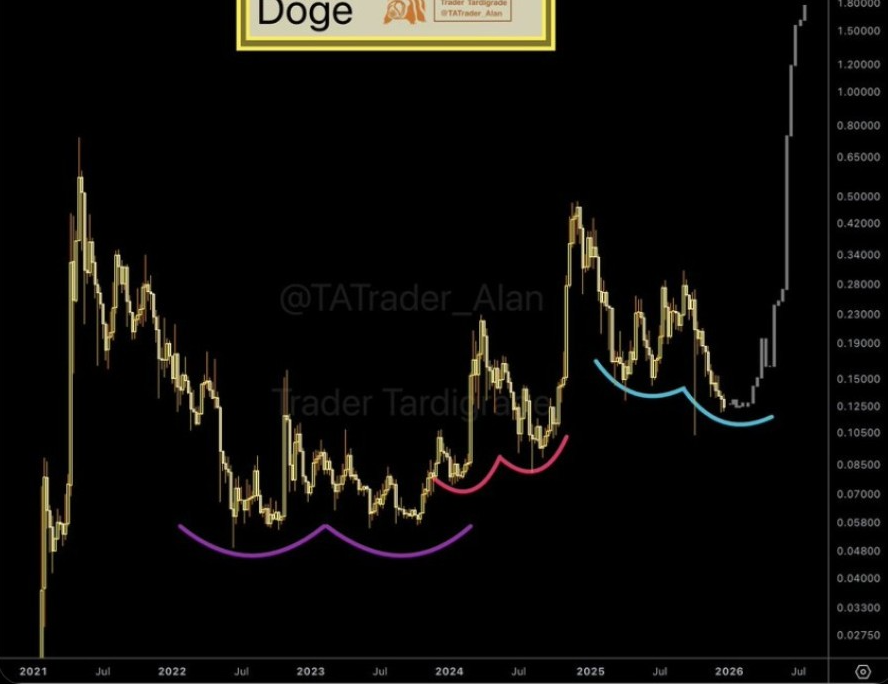
On the most recent swing, the chart shows a higher-low sequence after the 2024–2025 move. Dogecoin price prediction compresses around the mid-range and then starts turning up again. The right-side projection points to a new impulse phase in 2026 and suggests that prices will move beyond prior resistance zones.
DOGE Price Weekly Wedge With a Break Line
Ali Charts shared a wedge drawing on the weekly chart, with Dogecoin price tightening between a descending resistance line and a supporting trend line. As the range narrows, the pattern focuses attention on whether the market resolves above resistance or loses support near the lower boundary.
The chart notes that a breakout usually needs strong weekly closes above the wedge ceiling. Without that confirmation, the wedge remains a consolidation map rather than a completed move. The same drawing sets a clear risk line, marking $0.13 as the level that must hold to keep the setup intact.
Dogecoin Price Prediction: $0.13 Support, Targets at $0.19, $0.36, and $0.80
Ali Charts labels $0.13 as key support and the primary invalidation level for the wedge. A weekly close below that line would place price under the structure’s support and shift attention to lower ranges. Holding above it keeps the bullish path open and keeps the wedge’s upper trend line as the next hurdle.
If DOGE price stays above $0.13, the wedge targets point to $0.19 as the first checkpoint, followed by $0.36, and then $0.80. On the chart, the $0.19 area is near the wedge’s upper boundary and a prior weekly pivot, making it a nearby test after any breakout.
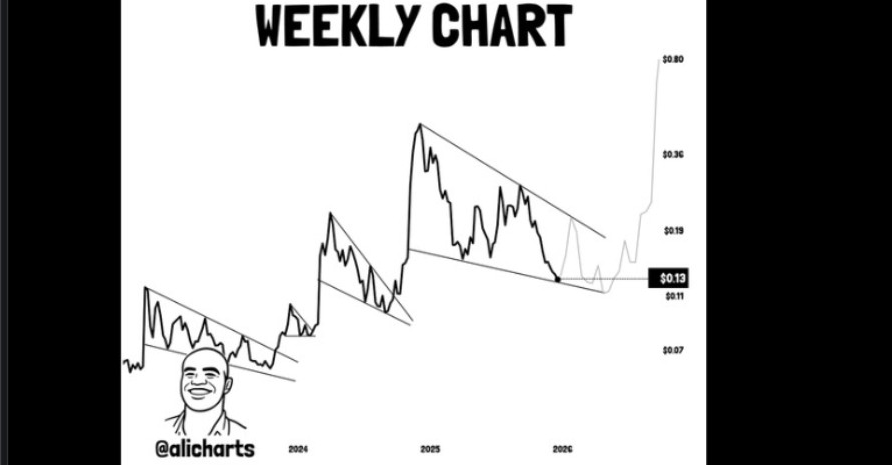
DOGE $0.36 level appears around a previous rally zone where sellers previously controlled the closes. Meanwhile, the $0.80 mark is in the upper weekly range from the last cycle and would place the price above multiple resistance bands on the drawing.
Upward Channel and an ATH Retest Zone
Additionally, analyst Javon Marks stated on December 27 that another major advance for DOGE back toward its all-time high remains on his radar. His weekly chart placed Dogecoin price prediction inside an upward-sloping channel, with higher swing points that repeat within rising boundaries.
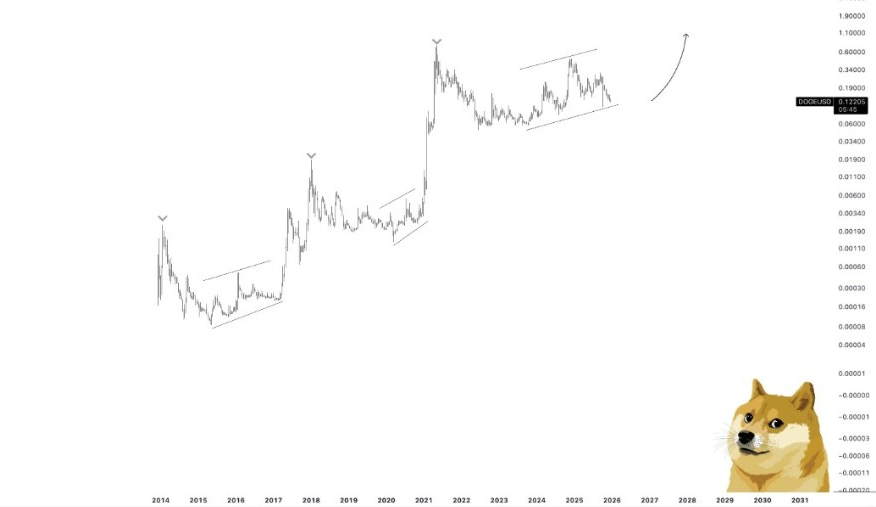
Dogecoin’s prior record high sits near $0.73, and Marks’ arrow points beyond that zone if weekly strength continues. For this Dogecoin price prediction, $0.13 remains the support level, while $0.19, $0.36, and $0.80 act as the nearer upside targets.




