
 Pearl
Pearl Bitway
 Pudgy Penguins
 Optimism
 Walrus
 NEAR Protocol
 Pons
Pons

Dogecoin price is showing conflicting signals on multiple timeframes. While some patterns point to the short-term weakness, others point to a long-term rally. Traders are now facing uncertainty as DOGE takes on major technical zones.
Dogecoin Price Breaks Below Pennant Support Zone
Dogecoin price recently broke down from an important bearish pennant pattern on the 4-hour chart. This development indicates a possible move towards the $0.108 support level. The pattern was highlighted by Trader Tardigrade, who noted that DOGE failed to hold the triangle support. This kind of breakdown often results in the continuation of the preceding trend, in this case, bearish.
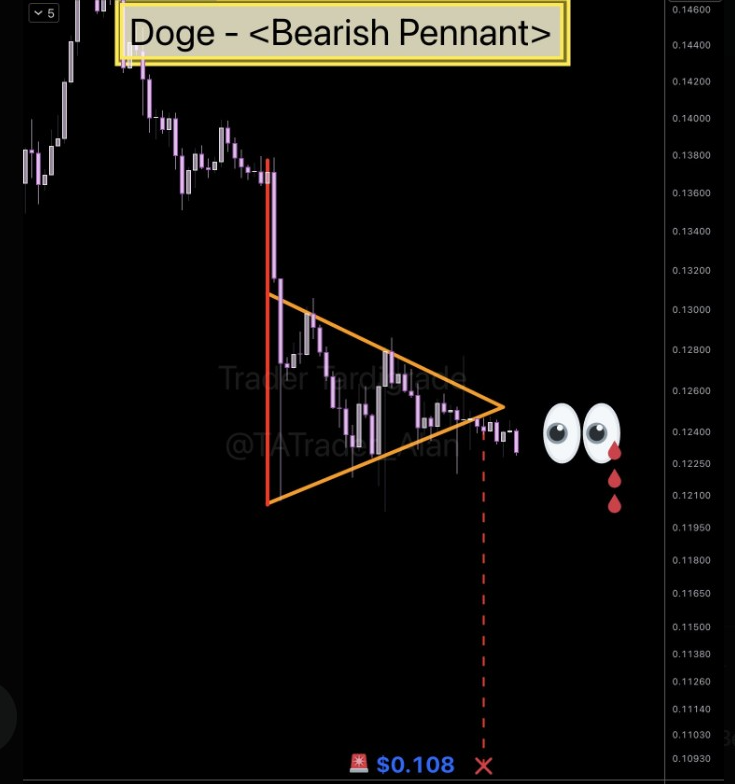
According to the analyst’s chart, the pennant developed after a steep drop and stamped before breaking lower. The forecast based on this pattern puts the Dogecoin price at risk of returning to the $0.108 zone.
If volume rises alongside price rejection at $0.125, downside pressure could intensify. For now, traders should keep an eye on $0.120 as near-term resistance. A close above that level may invalidate the bearish setup.
Macro Chart Supports Bullish Long-term Outlook
Despite the recent weakness, the long-term Dogecoin price chart suggests that bullish potential remains intact. Trader Tardigrade posted a weekly chart of DOGE/USD with a consistent macro pattern. He pointed to three historical cycles in which prices formed rounded bottoms before huge rallies. The present structure reflects those past phases.
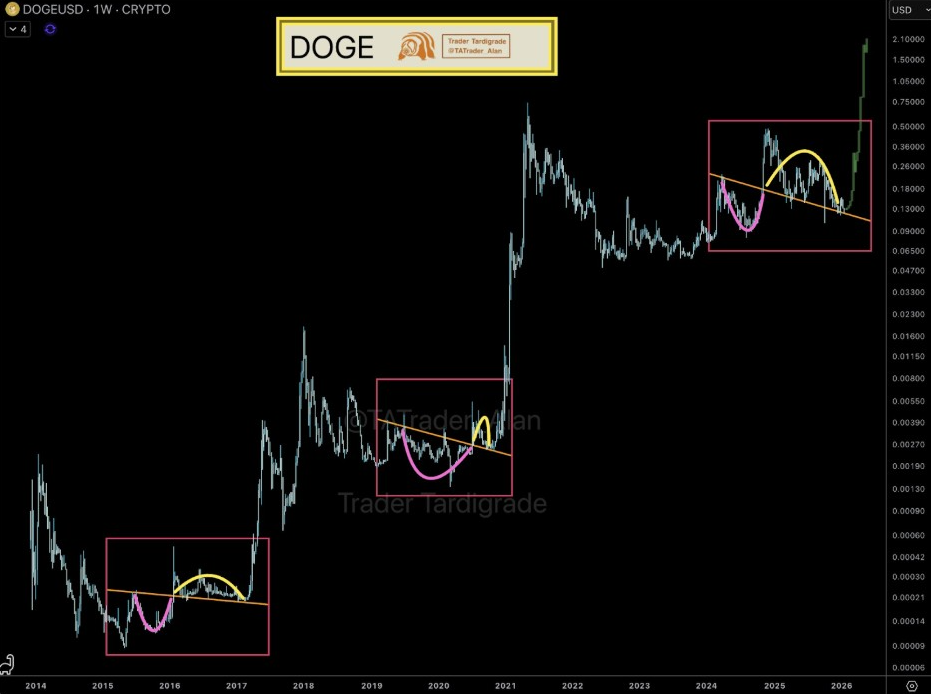
The chart shows a large consolidation zone, followed by a breakout pattern now forming. Every time it happened in the past, there were exponential gains. This repeating pattern reinforces the idea that DOGE may explode in the next few months if it repeats.
Notably, the analyst emphasized that this pattern has been observed for several years and requires patience. For now, Dogecoin price needs to remain above important macro support at $0.070 to continue respecting this structure.
If the bullish cycle continues, DOGE price could also break above $0.20 in early phases. Some longer-term models even point toward $1.00 over time. However, such projections rely on broader market support and renewed sentiment. The macro pattern alone does not ensure a breakout without confirmation.
Doge/BTC Pair Shows Potential for Outperformance
Furthermore, the relative performance between Dogecoin and Bitcoin also provides some context for where DOGE sits. On the weekly DOGE/BTC chart, Trader Tardigrade posted a pattern of multiple Doge pumps. These cycles had rounded bottoms, like DOGE/USD. The chart indicates declining variation but constant timing.
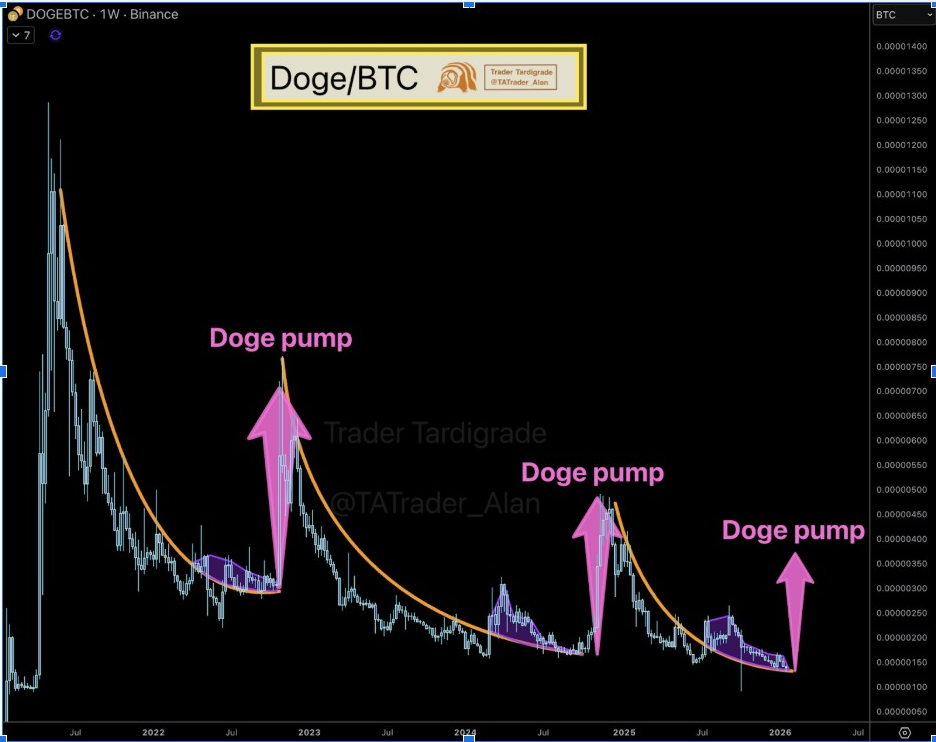
The analyst identified three major Doge/BTC breakouts, all of which occurred after a long downtrend. The current formation is suggestive of another pump forming, even if smaller than in previous cycles. If Bitcoin holds, Dogecoin has the potential to outperform in the short term. This would be bullish on a relative rotation out of BTC and into altcoins.
The curve of resistance shown on the chart may act as a trigger line. A breakout confirmed above this descending arc could be the next DOGE/BTC rally. If history is repeating, this move could be followed by a larger price surge in DOGE. Traders are looking for early indications of volume or breakout candles.
RSI Breakout Brings Hope for Short-term Bounce
While price action indicates weakness, momentum indicators point to a possible bounce ahead. On the 4-hour time frame, Trader Tardigrade also highlighted a breakout of RSI. Both the Dogecoin price and RSI have broken their respective descending trendlines. This move is often a change in short-term momentum.
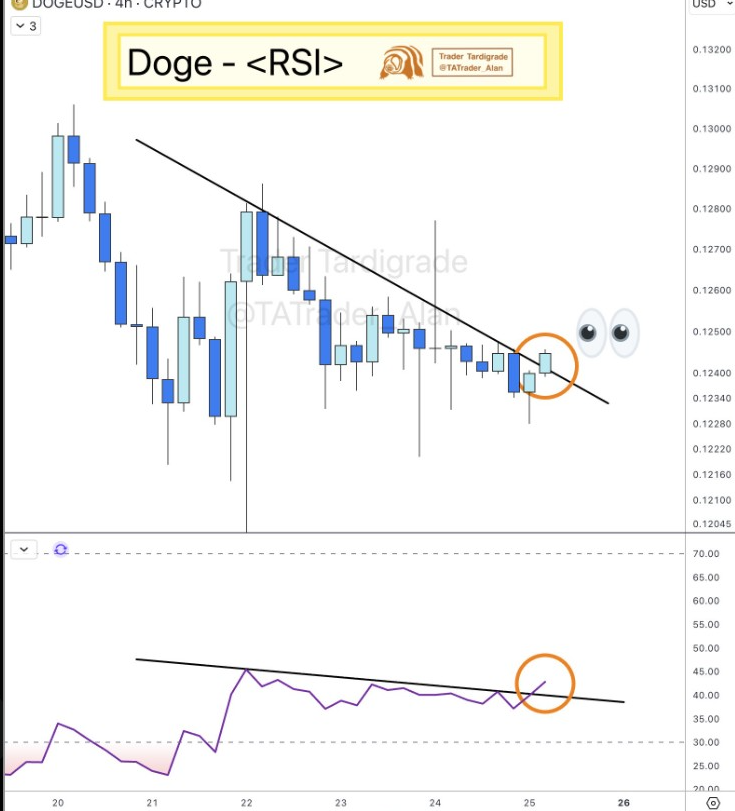
The RSI value has risen to over 45, a level not seen recently. This may appeal to buyers looking for short-term opportunities. If RSI can continue higher and DOGE price can reclaim $0.126, a recovery can start. However, first, DOGE’s price must hold support near $0.118 to sustain any bounce.




