
 Pearl
Pearl Walrus
 Bitway
 Bitcoin
 Quantus
 Quant
Quant Pudgy Penguins

Dogecoin price is trading near a key technical level that traders are monitoring on the daily chart. DOGE price action has compressed after a rebound from December lows. That kept the meme coin in a narrow range.
Analysts tracking Dogecoin price prediction point to a bullish reversal pattern forming as DOGE tests resistance. The main level in focus is $0.152, which has acted as a neckline for the current setup. A break and daily close above that area would shift attention to higher targets.
Dogecoin Price Prediction: Neckline at $0.152 Becomes the Trigger
Dogecoin price has spent recent sessions consolidating below the $0.152 resistance zone. It is the neckline of an inverse head-and-shoulders pattern.
The level has capped upside attempts while price remains supported above the mid-$0.13 region. Analyst noted a strong daily close above the neckline will confirm a breakout.
On TradingView, DOGE price formed a structure that includes a left shoulder, a deeper head, and a right shoulder. The neckline aligns with the same resistance band that rejected the price during earlier attempts.
Momentum traders watch this zone closely. DOGE trades near $0.15 and sets up the trigger.
DOGE Inverse Head-and-Shoulders Pattern
Dogecoin price’s current pattern shows a head near $0.117, with the shoulders forming above $0.138. The neckline sits around $0.152. This marked the line that separates consolidation from a potential continuation move.
If the meme coin price clears that area with follow-through, technical projections from the pattern point to the $0.186 zone.
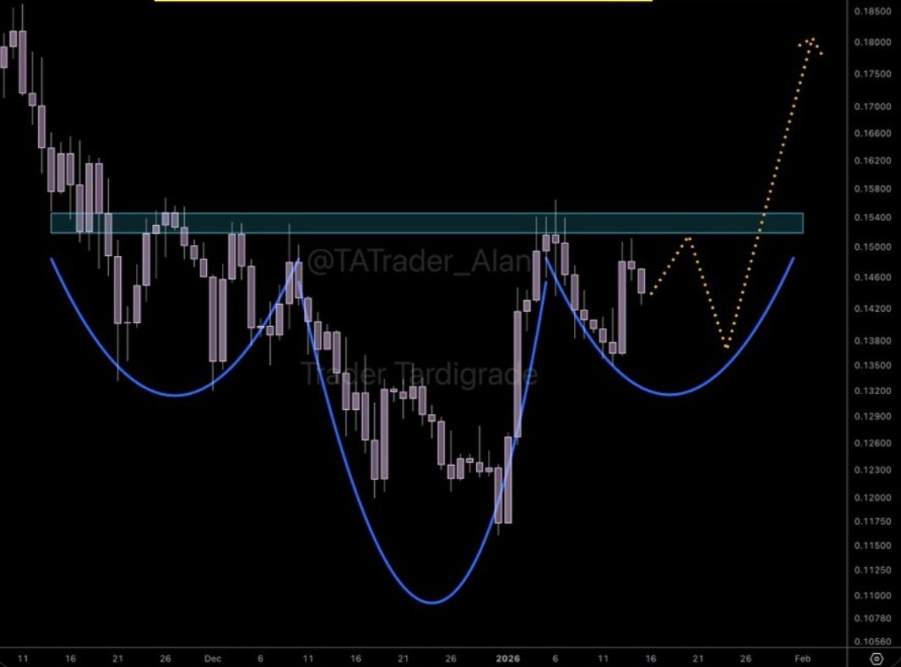
The $0.186 level will represent DOGE’s strongest recovery level in months, based on recent chart structure. Some Dogecoin price prediction estimates that a move from the neckline to the target region would represent 22% upside, assuming the breakout holds after the close.
Dogecoin price estimates suggest a move from the neckline to the target region. This shift could represent a 22% upside. The breakout must hold after the close for the prediction to play out.
The right shoulder developed after DOGE rebounded from below $0.13. With this, the analysts noted a momentum shift during the recovery phase.
Price has since moved sideways below the neckline, producing a tight compression range. Similar consolidation periods have previously preceded breakout attempts in DOGE during earlier rallies.
Whale Accumulation and Key Dogecoin Price Support Levels
Alongside the chart setup, whale activity has also been cited in recent coverage. One report said large holders acquired about 297 million DOGE over 24 hours. Such accumulation is often tracked as a positioning indicator during consolidation phases, especially near key technical levels.
Dogecoin continues to attract attention because of its liquidity and retail participation during momentum periods. Whale accumulation does not confirm a breakout. However, it has been referenced as a supportive factor as DOGE trades just below the neckline.
With price hovering near $0.15, traders are watching for confirmation through higher volume and a sustained move above resistance.
If Dogecoin price fails to break above $0.152, the top meme coin will rotate back toward the nearest support zones. The first area mentioned is $0.138, which aligns with the shoulder structure and recent reaction levels.
A drop back into that range would keep DOGE within the broader consolidation structure seen on the daily chart.
A further pullback would bring the $0.117 value back into the limelight. That was the lowest point of the head in the pattern. A rebound of DOGE price to that point would undermine the inverse head-and-shoulders formation and the breakout theory.


