
 Pearl
Pearl Zylo Ecosystem
 Starknet
 Walrus
 Sui
Sui Bitway
 Pons
Pons

The MSTR stock price has been in a freefall since July last year, when it peaked at $456. It slipped below the key support level at $150 last week, and fundamentals suggest it has more downside when the market opens on Monday, now that its Bitcoin holdings briefly went underwater on Saturday.
Strategy Bitcoin Gets Briefly Underwater
Michael Saylor’s Strategy has spent the last few years accumulating Bitcoin, a move that has made it the largest Bitcoin holder in the world.
Strategy has accumulated 712,647 Bitcoin since 2020, with its holdings currently being valued at over $55 billion.
The challenge, however, is that his holdings briefly went underwater on Saturday as the Bitcoin price crashed below his cost basis.
Data compiled by Bitcoin Treasuries shows that the average purchase price since he began accumulating stands at $76,000, giving him a profit of just 3%. In contrast, the S&P 500 Index has jumped by double digits since the company began accumulating Bitcoin.
The strategy’s main issue is that it has been a non-stop Bitcoin accumulation strategy for years. As such, while the Bitcoins it bought in December 2022 are profitable, those it bought in the past few months are unprofitable as the coin has been in a strong downward trend, moving from a record high of $126,300 to the current $78,000.
Meanwhile, the premium that the company had for years has evaporated. Data shows that the company has a market capitalization net asset value (mNAV) of 0.768. Its enterprise value-based mNAV has dropped to 1.03 as its enterprise is $58 billion against the Bitcoin holdings of $56 billion.
The NAV is an important multiple because it looks at whether the company is trading at a premium or a discount. For a long time, the company traded at a premium, making it a better investment than Bitcoin or spot Bitcoin ETFs.
Strategy at Risk as Bitcoin Price Faces Major Headwinds
The MSTR stock price has remained under pressure over the past few months due to ongoing weakness in Bitcoin prices. Bitcoin tumbled to a low of $75,000 on Saturday, down sharply from its all-time high of over $126,000.
There are a few reasons why Bitcoin has tumbled. First, that market is still reeling from the large liquidation event on October 10 last year, when $20 billion was wiped out. Data shows that its open interest has continued to fall since then, down to $55 billion from last year’s high of over $90 billion.
Second, the Bitcoin price crashed as market participants reacted to Donald Trump’s selection of Kevin Warsh as the next Federal Reserve Chairman. Warsh has a long history of having hawkish views, meaning that he will likely not cut interest rates as quickly as Donald Trump expects.
Third, Bitcoin has dived as exchange-traded funds (ETFs) have continued to experience outflows. Data shows that these funds shed over $1.6 billion in January, higher than the $1.09 billion they lost in December. The funds have lost over $6 billion in the last three months, bringing the cumulative total net inflows to $55 billion.
MSTR Stock Price Technical Analysis
The daily timeframe chart shows that MSTR stock has been in a strong downward trend over the past few months, falling from a high of $456 in July last year to the current $150.
It has remained below the Supertrend indicator, and last week, it moved below the key support level at $150, the lower side of the bearish flag pattern.
Strategy stock has remained below the 50-day and 100-day Exponential Moving Averages (EMA). It is also below the Ichimoku cloud.
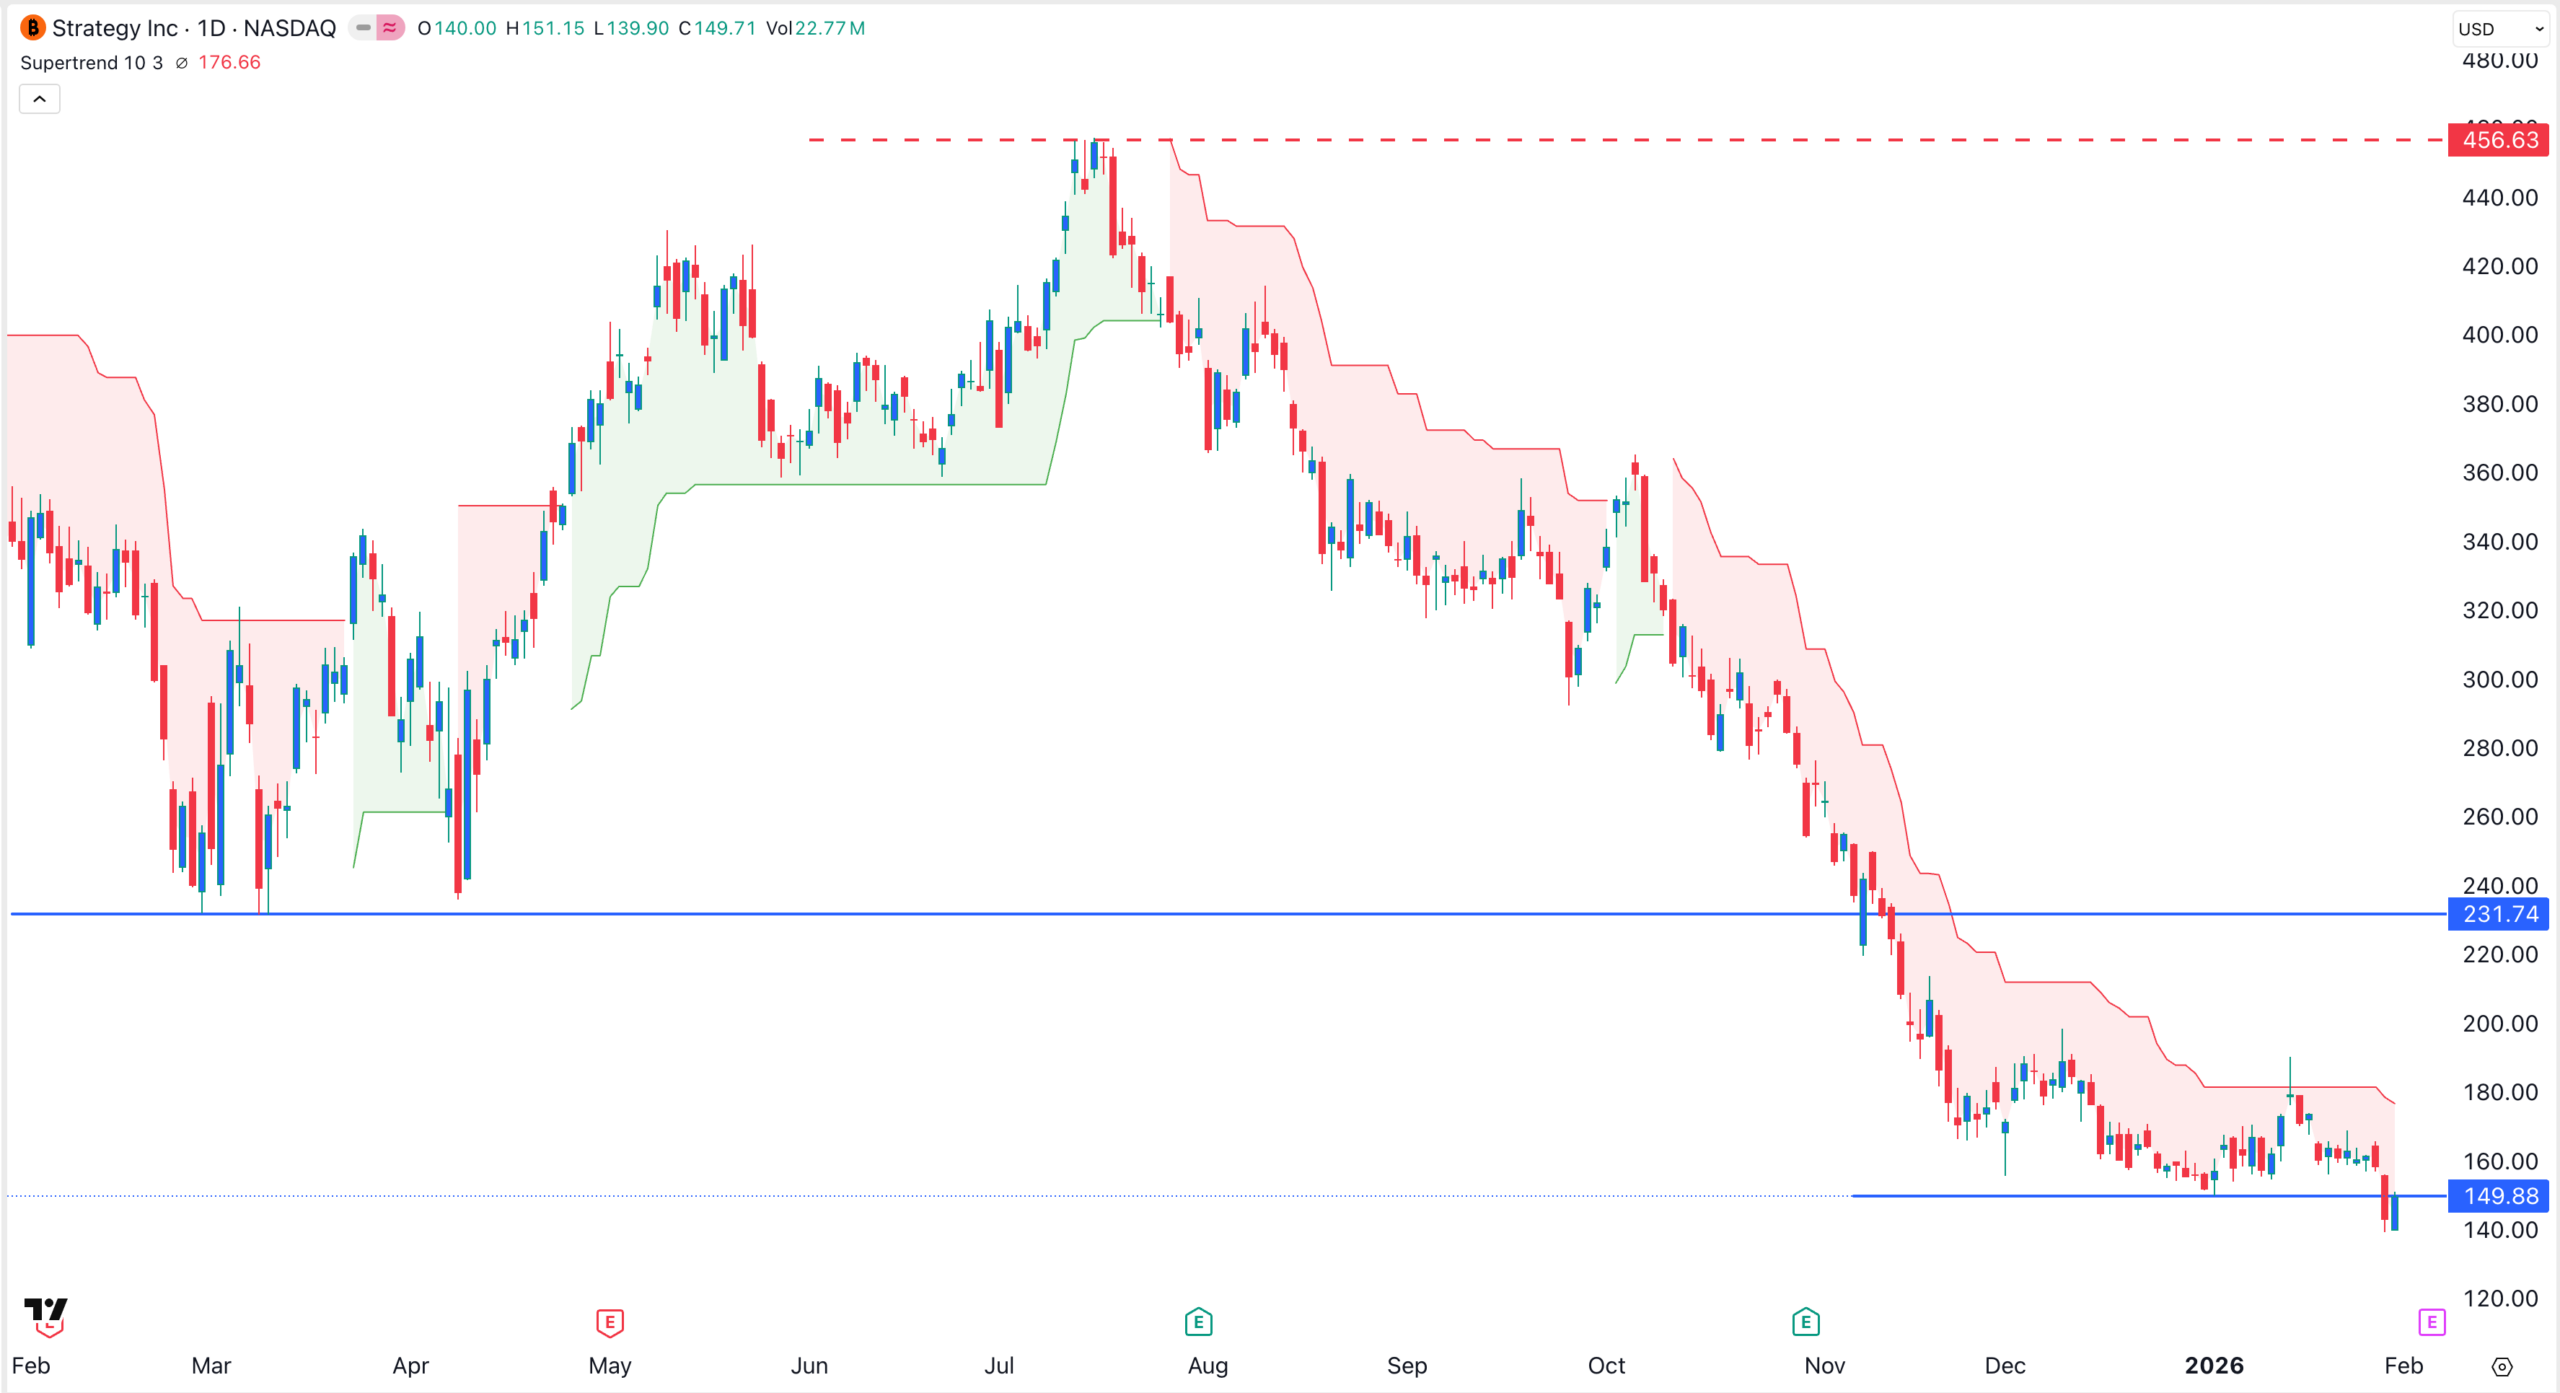
Therefore, the stock will likely continue to fall as sellers target the next key support level at $100, which is well below the current $150.




