Pearl
Pearl Zylo Ecosystem
 Sui
Sui Starknet
 Pons
Pons NEAR Protocol
 Quantus

Bitcoin (BTC) is hovering below the $70,000 level, with price action showing mixed sentiment. Participants’ behavior shifted, though there was no clear direction bias.
Bitcoin price was teasing a 15% move in the short term. However, the data showed that the jump could go either way. But why were Short-Term Holders (STHs) still under pressure despite profit-taking reductions?
Monthly Bitcoin Realized Profits-to-Value
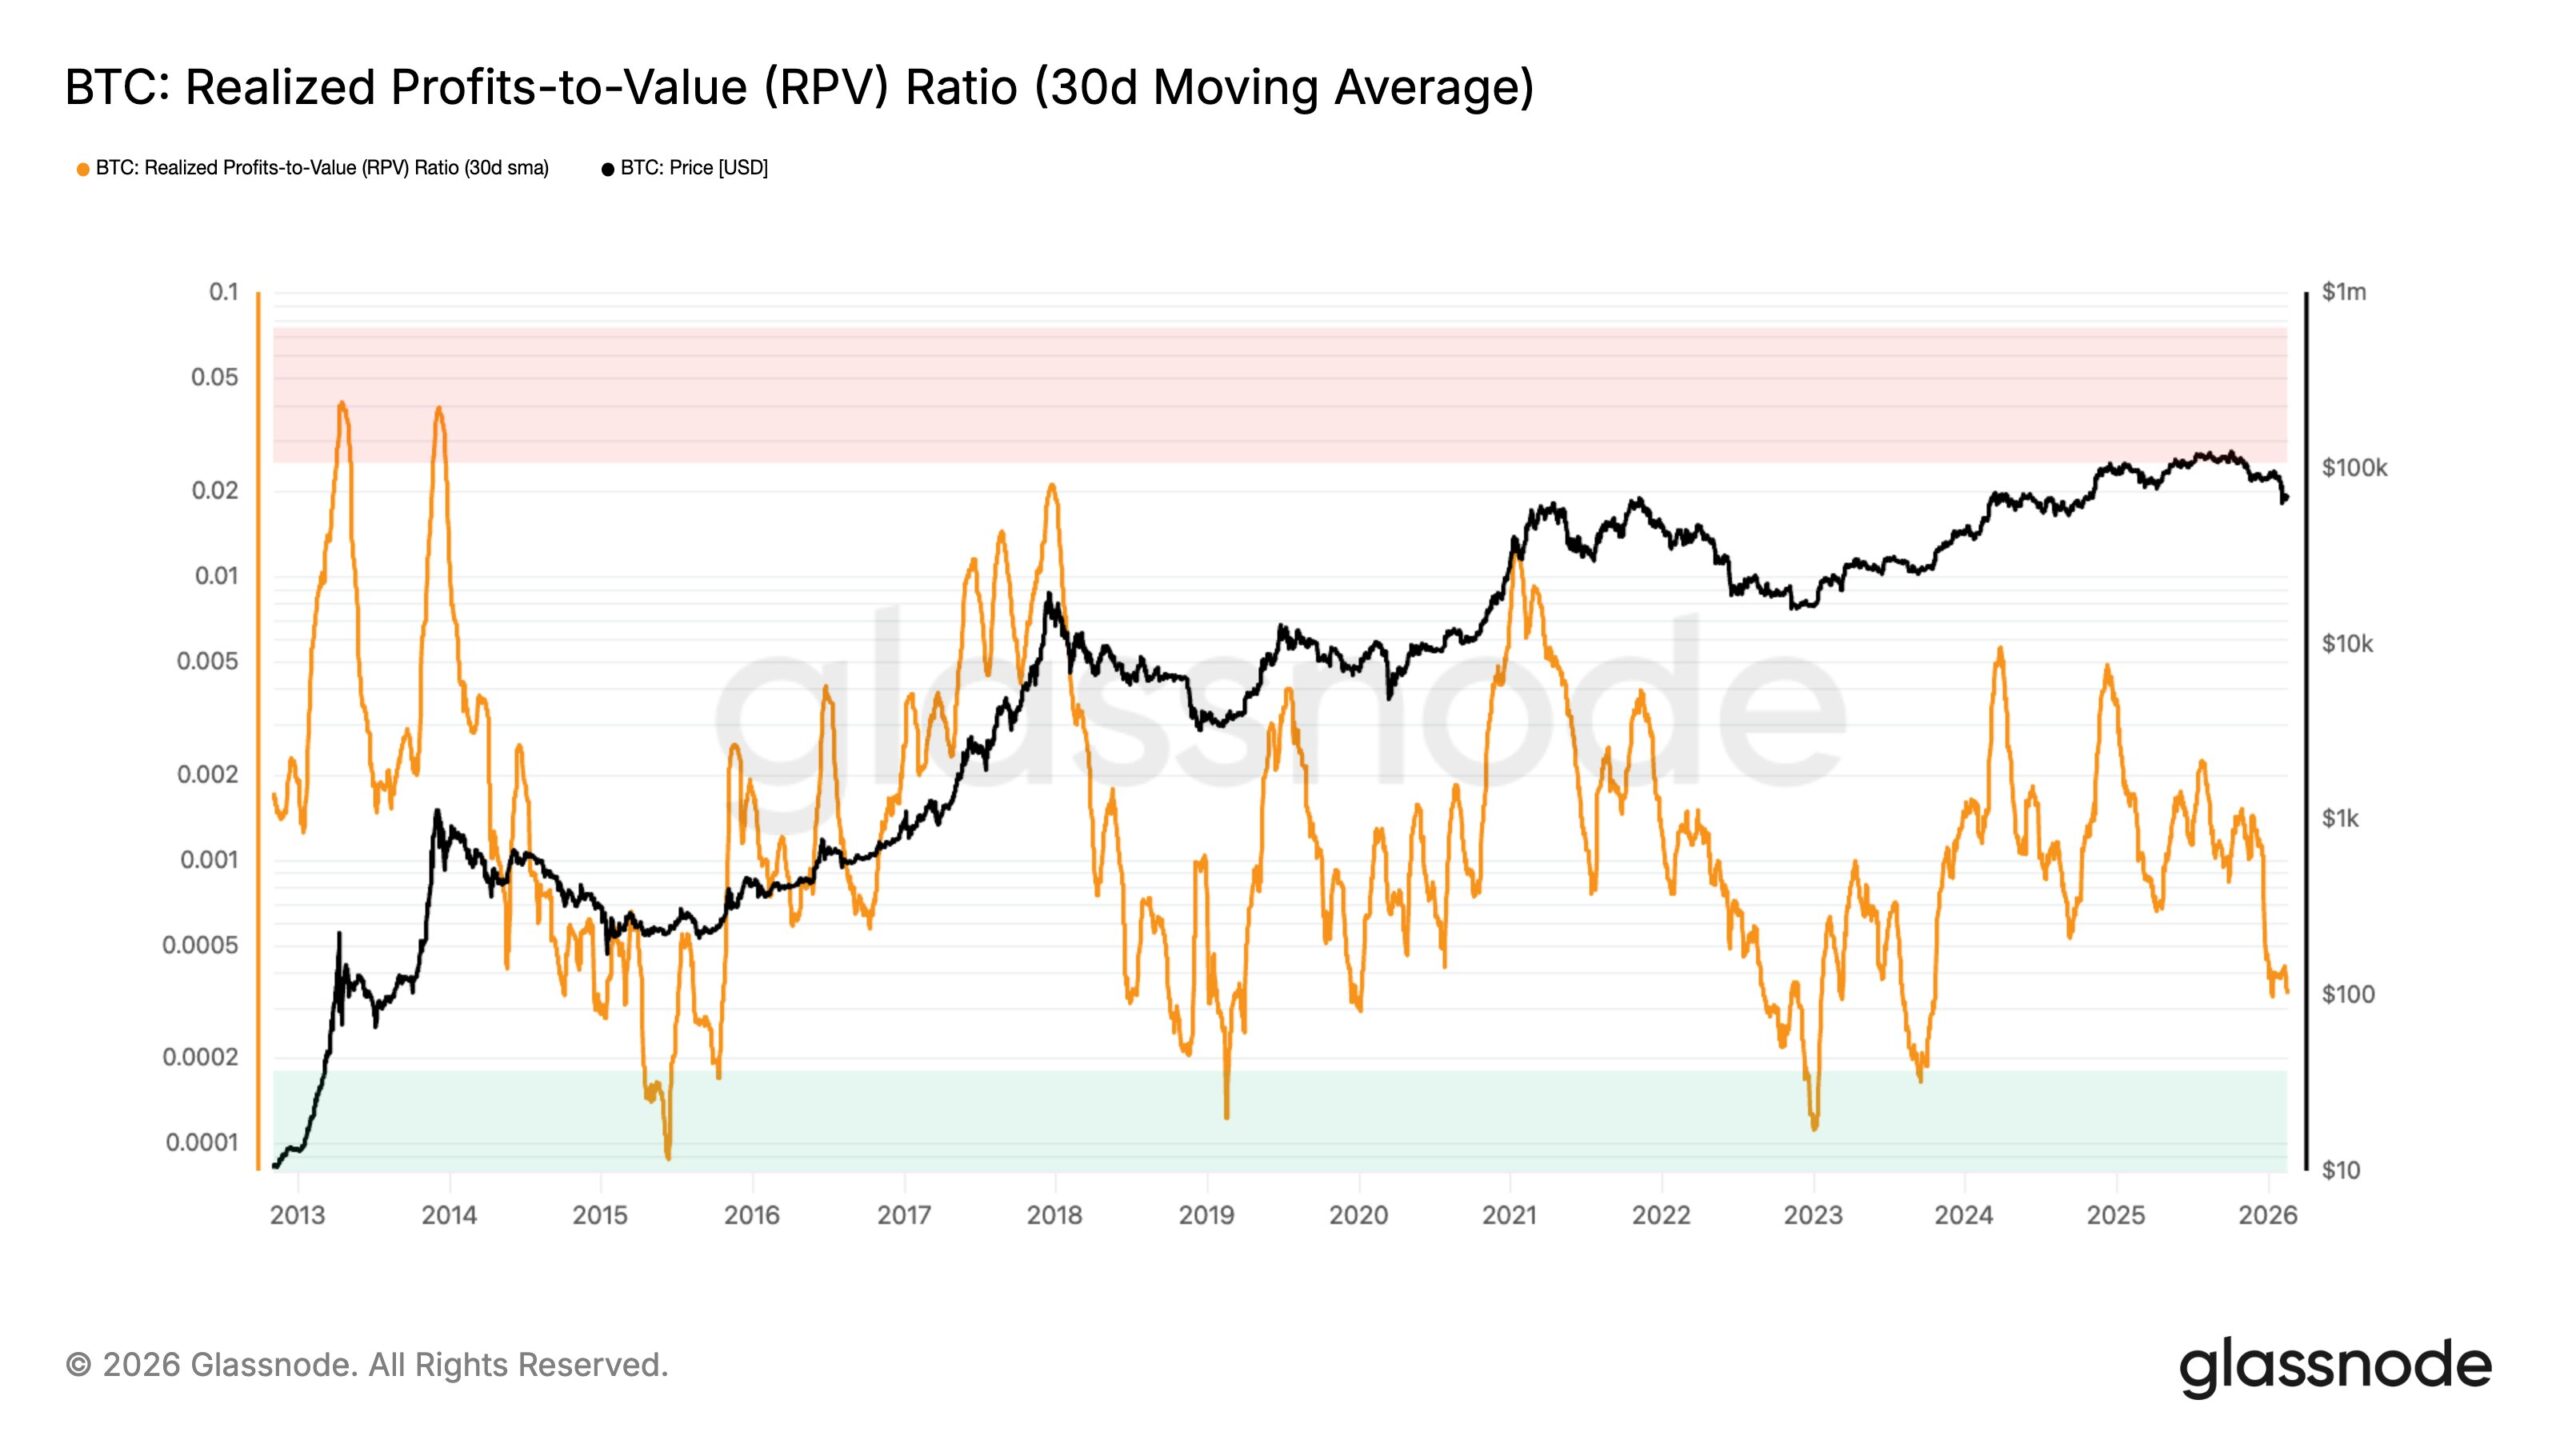
The Realized Profits-to-Value (RPV) Ratio, overlaid with a 30‑day moving average, revealed the scale of profit-taking in Bitcoin. It showed traders actively locking in gains relative to the asset’s overall value. This was in comparison to the value of the asset.
Historical data showed that the metrics rose during price spikes, suggesting heavy selling at the top. For instance, sharp RPV rises happened at the same time as BTC price rallies in 2017 and 2021.
But correlations get weaker when things go wrong. RPV reading dropped sharply recently, undoing previous moves.
For now, it stayed above the capitulation band, which meant that profits were still coming in, but not all of them. This cooling in selling pressure suggested that the market participants were shifting their behavior.
As such, it could help things stabilize. This would make it easier for the economy to bounce back if traders resumed buying.
If low activity continues for an extended period, it can prolong sideways price movement. Over time, this stagnation may even trigger deeper declines as momentum fades.
Why Short-term Bitcoin Holders Are Still Under Pressure
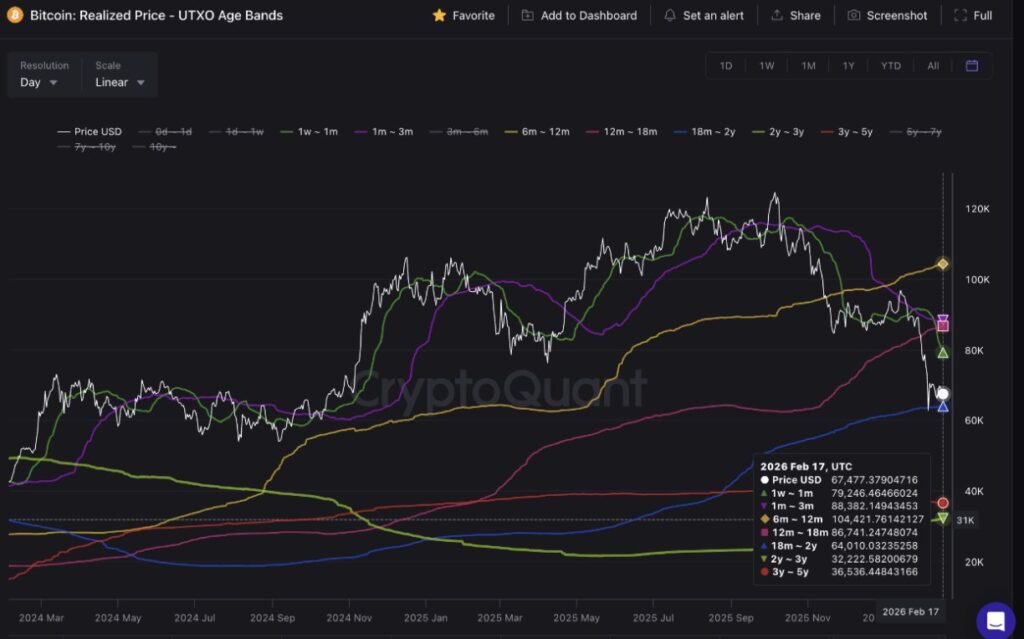
Bitcoin was trading around $67,477, which was well below several short-term realized price bands. This meant that short-term holders (STHs) were still under sell pressure.
The one-week-to-one-month band was close to $79,246, while for the three-month group, it was close to $88,382. From a year’s perspective, the band was even higher, at about $104,422. Hence, a trend recovery could stay limited until these levels are reclaimed.
The realised prices over a longer period were near $32,223 and $36,536. They were significantly below the spot price. This meant structural downside risk was still there. However, the bear stress was less.
But why were STHs still under pressure despite reduced profit-taking? As reported by the Coin Bureau, capital flows were negative, thus explaining this phenomenon. For context, the entire crypto market saw its biggest outflows since 2022, and Bitcoin was no exception.
BTC and Ethereum (ETH) were declining in price, hence the loss in capital. Again, the stablecoin supply was not growing either, indicating that tighter liquidity was also an issue, causing price lag.
This increased the likelihood that STH’s unrealized losses would persist. However, the current price action setup could invalidate such an outcome.
Bitcoin Price Prediction: Which Direction Is the 15% Rally Headed?
As for the price action, Bitcoin was undecided as it traded in a symmetrical triangle on the 1-hour chart. The crypto was stuck between descending resistance and ascending support but close to the apex of the triangle. This tightening of the price action indicated a looming volatility surge.
Hence, the pattern hinted at a potential 15% rally if a breakout was successful. If the price broke above $70K, it could go up to $80K. But a drop below $66K could lead to a drop toward $62K or lower levels.
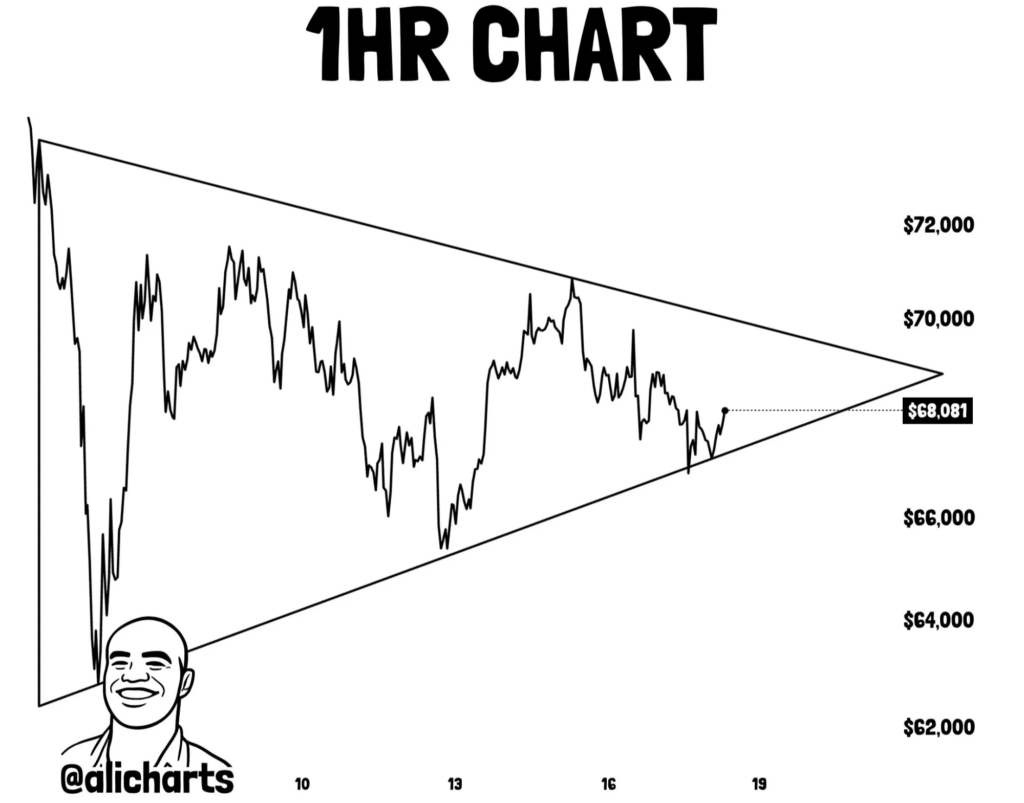
In summary, the pattern showed that the price range was getting tighter. Momentum was slowing as buyers and sellers battled for control. So, a strong and clear close outside the triangle boundaries would probably confirm the next move.