
 Altai the Tiger
 IGNITION
 streamoors
 Sword Inu
 NEAR Protocol
 Injective
 Quantus
XRP price traded near $1.38-$1.39 on Sept. 10 as traders prepared for the latest U.S. inflation report. Spot activity on Binance has cooled significantly from the surge seen during the second half of August. Meanwhile, XRP ETFs continued attracting capital even as derivatives sentiment turned more defensive.
The mixed signals leave XRP between institutional inflows and softer short-term market momentum. Immediate support remains around $1.35-$1.33 on the supplied charts, while the $1.46-$1.55 region presents the first meaningful recovery hurdle. Friday’s Consumer Price Index report provides the next major macro catalyst.
XRP Price Holds as Binance Trading Volume Normalizes
XRP price trading activity on Binance has slowed after the expansion during the second half of August. The 30-day Volume Z-Score rose above 4 when XRP crypto climbed from near $1.00 to above $1.40.
That reading has since dropped toward zero and reached about -0.09 on September 9. XRP traded near $1.419, then, showing volume had returned close to its 30-day average.
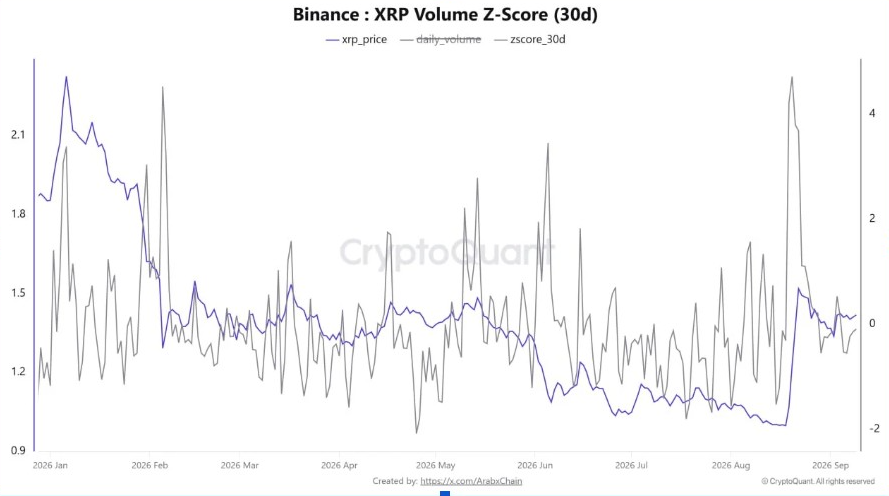
The lower Z-Score tracks weaker short-term participation rather than a fresh price breakdown. XRP has held close to $1.40 even as exceptional August trading activity faded. A renewed rise in Binance volume would push the indicator back into positive territory. Readings near zero show spot participation has not returned to August levels.
XRP ETF Inflows Continue Despite Price Weakness
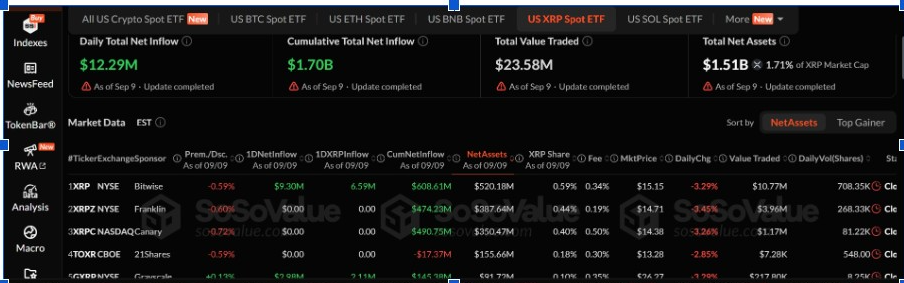
U.S. XRP ETFs recorded $12.29 million in net inflows on September 9. That marked their strongest daily inflow since September 1, according to SoSoValue data.
XRP also ranked behind only Ethereum for daily crypto ETF inflows. Ethereum products received $34.75 million, while Bitcoin ETFs recorded $120.24 million in outflows.
The ETF data contrasts with weaker conditions in XRP’s spot and derivatives markets. Funding on XRP futures fell to -0.0094%, its lowest reading since June 28.
XRP crypto negative funding shows short sellers are paying long traders to keep positions open. The long-to-short reading dropped to 0.0089, pointing to heavier short exposure across tracked accounts.
Inflation Data Keeps Support in Focus
XRP price fell to its lowest level in a week as markets positioned for the September 11 U.S. CPI release. Analysts expect August core CPI to rise 0.22% month over month.
Headline CPI estimates sit near 0.39% monthly, while core CPI may ease to 2.4% year over year. Interest-rate expectations have moved higher as traders assess persistent inflation pressure.
On the four-hour chart, XRP price is testing support around $1.35. A close below that level would expose the September 2 low near $1.33. The Chaikin Money Flow reading sits near -0.09, showing stronger selling pressure than buying pressure. RSI near 36 places, momentum below its neutral 50 level.
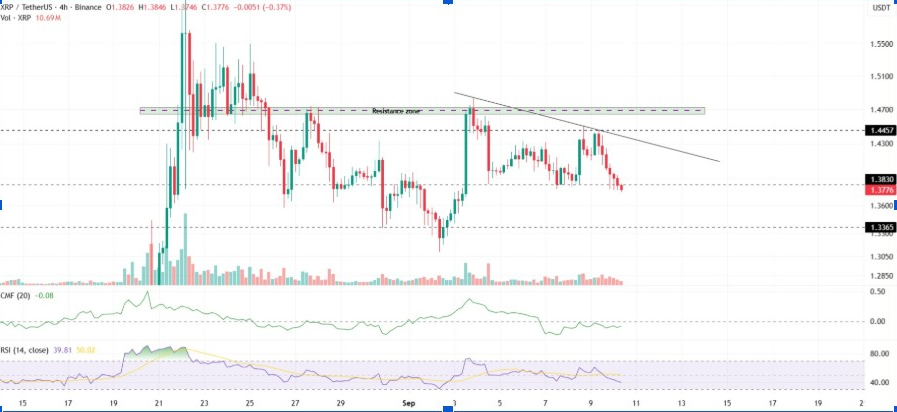
If buyers regain control, XRP price faces resistance between $1.46 and $1.47. That zone comes before the larger moving-average barrier near $1.55.
XRP Price Prediction Puts $1.55 Reclaim at Center
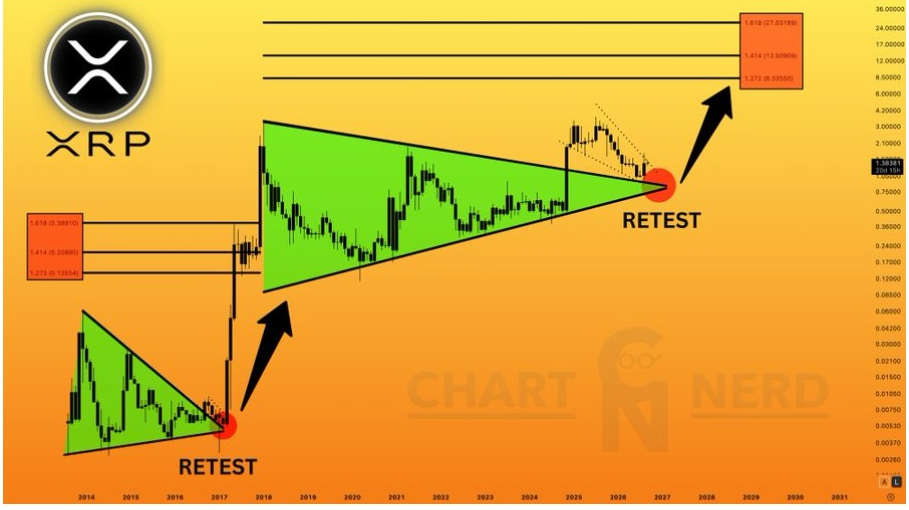
The longer-term XRP price chart shows price pulling back toward a previous breakout area after a multi-year triangle expansion. A similar structure appeared before the 2017 breakout, followed by a retest near former resistance.
The current chart maps a comparable retest around the $1 area before projecting higher Fibonacci zones. The XRP price prediction targets sit near $8, $13, and $27, depending on the retest holding.
A second long-term chart tracks XRP against its 20-month exponential moving average. XRP crypto pushed into that average during August for the first time since January 2026. The 20-month EMA now sits near $1.55. The chart places the 50-week EMA near the resistance area after XRP failed to hold $1.70.
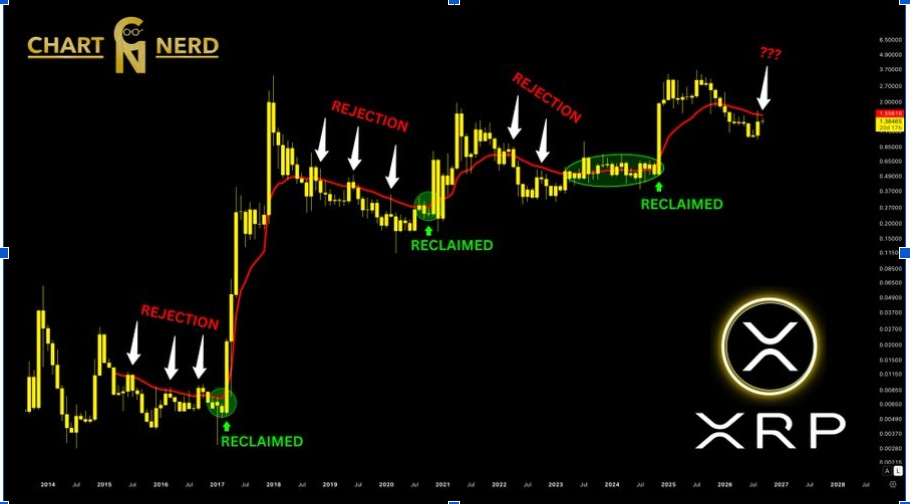
Previous cycles show repeated rejections when XRP crypto trades below these moving averages. The chart records stronger repricing phases only after XRP price reclaimed the averages and held them as support.
This article is for informational purposes only and should not be considered financial or investment advice. Cryptocurrency markets remain highly volatile. Readers should conduct independent research before making investment decisions.



