Zylo Ecosystem
 Walrus
 Bitcoin
 Sui
Sui Quantus
 Quant
Quant Starknet

Ethereum price has climbed back above $2,650 as traders watch the $2,700 resistance zone. A weekly close above $2,800 could open the path toward $3,963 and, later, the $4,850 area. Historical Ethereum setups produced gains ranging from about 65% to 135% after similar breakouts. From the referenced price near $2,723, a move to $4,850 would represent close to 80% upside.
Ethereum Price Prediction Hinges on $2,800 Breakout
ETH has recovered strongly from lower levels and now faces resistance between $2,750 and $2,800. This zone has acted as a barrier during previous phases of the market structure. The current setup requires buyers to push Ethereum through this range and hold the breakout.
A weekly close above $2,800 would give the market a clearer path toward the next resistance levels. The nearer target sits around $3,344 based on the 0.618 Fibonacci level from the longer-term setup.
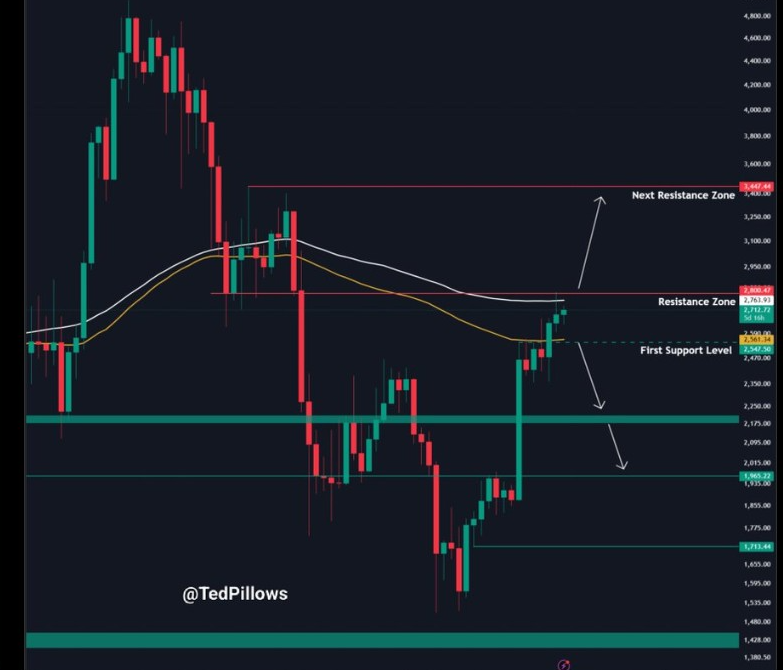
Another technical level appears near $3,447, while $3,963 marks a previous cycle-top area used in the broader price projection.
Ethererum Price Prediction: Historical Fractals Put $4,850 in Focus
Ethereum price has produced several large moves after breaking above similar resistance structures. Four earlier breakouts produced gains of approximately 65.8%, 93.4%, 91.0%, and 134.7%. Those figures form the basis for the current fractal comparison.
The historical moves provide a reference for the current structure, which again places ETH crypto near the upper boundary of its range. A sustained move above $2,800 would therefore bring higher technical levels into focus.
The longer-term Fibonacci setup places the 100% retracement near $4,867. That level sits close to the $4,850 target used in the current Ethereum price prediction. From $2,723, ETH would need to rise by about 78% to reach $4,850.
The $3,963 level sits near previous cycle highs and would require a move of roughly 45% from the referenced price of $2,723.
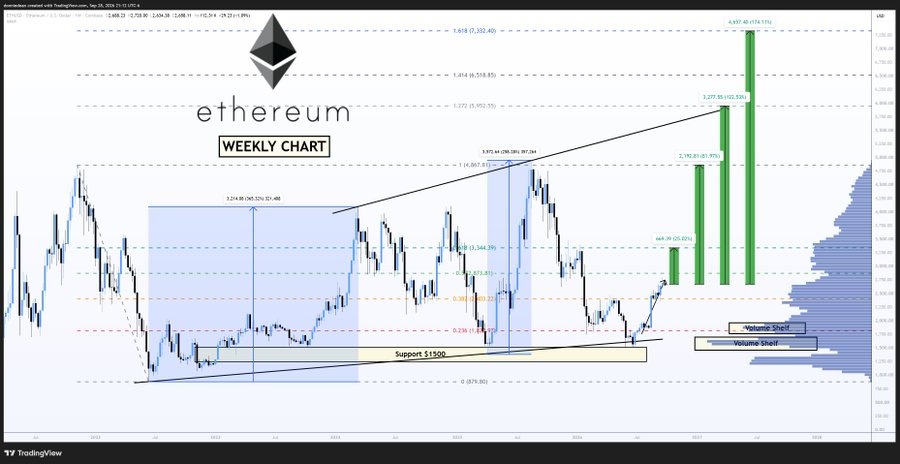
Ethereum price would need to clear several resistance areas during such a move. The $3,344 Fibonacci level and the area near $3,447 could act as points where sellers return to the market. A move through those levels would leave $3,963 as the next major technical area.
The second long-term setup also places a 1.618 Fibonacci level near $7,332. That level sits well above $4,850 and represents a separate extension target.
$2,150 Remains Key Support for Ethereum
However, the bullish structure would weaken if Ethereum price falls below $2,150. This level marks the lower boundary of the broader range. A sustained break below it could shift attention toward lower support areas.
The shorter-term setup places support near $2,547, while deeper levels appear around $2,175 and $1,965.
Meanwhile, in recent ETH crypto news, we reported that BitMine expanded its Ethereum treasury after purchasing another 17,362 ETH, pushing its total holdings above 6 million ETH. The company now holds about 4.9% of Ethereum’s total supply, with more than 5 million ETH staked as part of its treasury strategy.
The update came as Ethereum price recorded its strongest weekly close in eight months, with ETH trading above the 50-week moving average for the second consecutive week.