
 Altai the Tiger
 Sword Inu
 streamoors
 IGNITION
 NEAR Protocol
 Pearl
Pearl Injective

Ethereum price traded around $2,700 as improving fund holdings contrasted with increasingly bearish social sentiment.
Tracked Ethereum fund balances have recovered strongly since the July market drawdown. However, U.S. spot ETH ETFs recorded fresh outflows on Oct. 2, showing that the recovery has not progressed in a straight line.
Meanwhile, technical analysts are watching $5,000 as the major long-term breakout level before substantially higher projections come into focus.
Ethereum Price Trend and Spot ETH Inflows
Ethereum changed hands near $2,700 after gaining about 0.6% over 24 hours, while intraday trading remained relatively contained. ETH found support near $2,671 before moving above $2,730 and later settling around the $2,700 area.
The broader recovery has also been supported by renewed fund exposure, although the pace has varied across recent sessions. Ethereum holdings across tracked investment products have climbed from roughly 5.45 million ETH in July to about 6.7 million ETH.
That increase represents growth of about 23% to 24% in underlying coin holdings, rather than changes caused only by price appreciation. The recovery has brought fund exposure closer to its October 2025 peak.
Recent flows, however, have not moved in a straight line. Ethereum ETFs posted about $64.7 million in net outflows on October 2, according to Lookonchain. Earlier demand had been much stronger, and Ethereum ETF flows had already supported ETH near $2,400 in September.
Ethereum Onchain Data and Open Interest Stay in Focus
Ethereum’s fund recovery has occurred alongside a broader rebound in derivatives activity and market positioning. ETH open interest approached $30 billion in late September as traders increased exposure around the latest price recovery.
Options positioning also remains active into the October 2 expiry. Bybit and Binance had about $426.9 million in ETH options notional expiring, with max pain near $2,675.
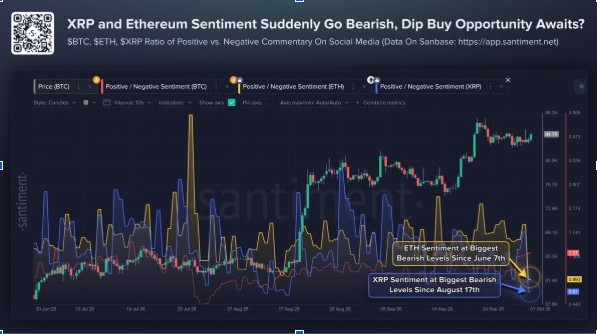
At the same time, social sentiment has weakened sharply as October begins. Santiment data showed Ethereum’s positive-to-negative commentary ratio falling to 0.89, its lowest reading since June 7.
A ratio below one means negative commentary now exceeds positive commentary across major social platforms. That does not confirm a price reversal, but it shows traders remain cautious despite stronger fund holdings.
The contrast between positioning and sentiment follows an earlier period when Ethereum shorts reached a 51-month high. ETH still held near $2,670 at that time despite the increase in bearish positioning.
ETH Crypto Technical Analysis and Analyst Forecast
Ethereum’s monthly chart places $5,000 as the main long-term resistance level. ETH has tested that region during previous cycles but has not maintained a monthly breakout above it.
The analyst’s bullish scenario depends on ETH closing decisively above $5,000 and holding that level. If confirmed, the chart places the next resistance area near $6,800 before a possible move toward $8,800.
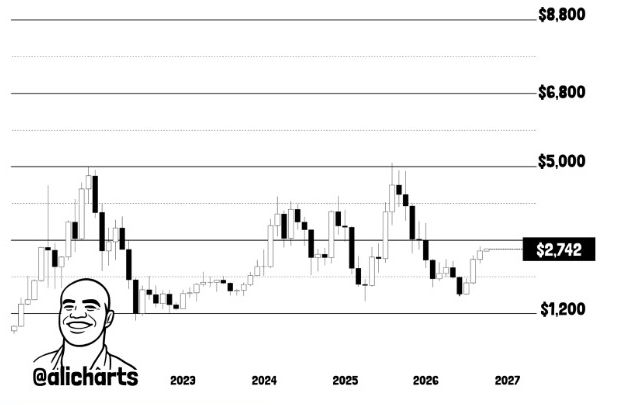
Those levels represent a long-term technical projection rather than a near-term price target. Ethereum still trades well below $5,000, so the breakout condition has not been met.
On shorter timeframes, ETH remains near the $2,700 region after recovering from September support around $2,400 to $2,500. The immediate structure improves if buyers maintain the recent recovery and continue absorbing selling pressure.
The wider monthly range still places major downside support near $1,200. Until ETH clears $5,000, the $8,800 target remains dependent on a breakout that has yet to occur.
This article is for informational purposes only and does not constitute financial or investment advice. Fund-flow data, sentiment indicators and technical price targets do not guarantee future market performance.



