astronaut
 Walrus
 Pearl
Pearl Bitcoin
 NEAR Protocol
 Zcash
Zcash Hyperliquid

QNT price has pulled back sharply after one of the strongest altcoin rallies of September.
Quant climbed from roughly $60-$63 in mid-September to an intraday high above $350 before sellers emerged. The token subsequently fell toward the $230-$240 region as traders reduced exposure following the rapid advance.
The correction has shifted attention toward potential support areas identified by analysts, including $195, $150 and the broader $115-$100 zone.
QNT Drops After Reaching a Five-Year High
QNT traded near $60 in mid-September before a sharp rally pushed the token toward $370. The move followed news that The Clearing House selected Quant for its On-Chain Money Initiative. The payment network operator processes more than $2 trillion in transactions each day.
The rally lifted QNT to a five-year high before selling pressure emerged. The token subsequently lost the $300 level and declined toward $237. At the time of the latest market data, QNT traded near $239, down about 18% over 24 hours.
Trading activity also weakened during the decline. Spot volume fell by roughly 33% to $474 million, while traders reduced exposure following the rapid price increase.
QNT Price Prediction: Analyst Watches $115 Support Zone
EGRAG Crypto has outlined a deeper correction scenario for QNT after selling the token during its previous cycle. The analyst pointed to $150 as an initial area of interest, followed by the $100 range.
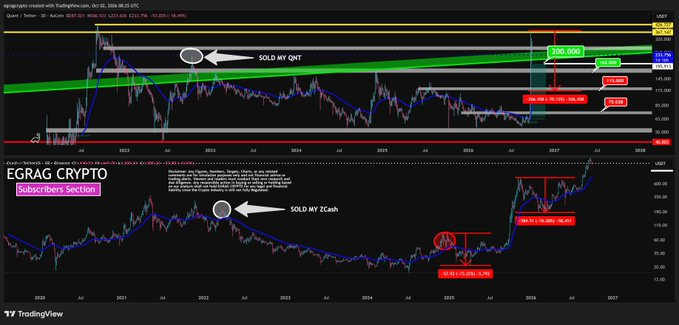
A move from the recent peak near $367 to $115 would represent a decline of about 69%. The analyst also identified roughly $75 as another potential level if the correction extends below the $100 area.
The QNT price prediction follows a sharp two-week advance. QNT gained around 300% during that period, leaving the token substantially higher than its mid-September price.
Ali Martinez previously identified $430 as a key resistance level for QNT. A sustained move above that level could open the path toward $2,000, according to his analysis.
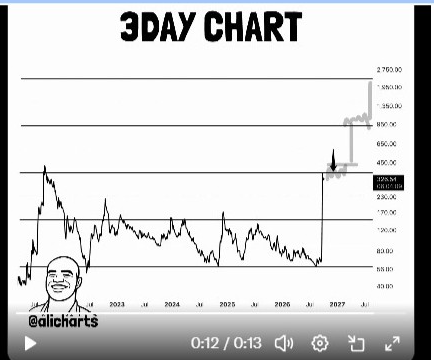
The level remains above the recent high near $370.
QNT Derivatives Data Shows Selling Pressure
QNT futures activity weakened as the token pulled back from its recent high. Coinglass data showed $408 million in futures outflows against $386 million in inflows over 24 hours. That left the futures netflow at negative $22.7 million.
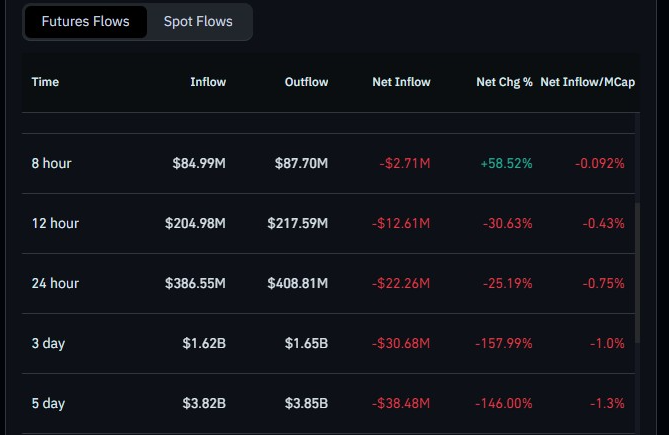
Open interest also fell 15% to $167 million during the same period. The decline suggests that traders reduced their futures positions as QNT moved lower.
Spot market data showed a similar shift in trading activity. QNT spot netflows turned positive at $1.3 million, compared with negative $11 million the previous day.
Positive spot netflows have appeared during several price pullbacks over the past week. The pattern shows increased selling activity as traders lock in gains following QNT’s sharp rally.
The latest futures and spot data point to reduced exposure after QNT price increase. With the token trading well below its recent peak, further profit-taking could keep selling pressure elevated.
QNT Price Faces $195 and $300 Levels
QNT’s daily chart shows weakening upside momentum after the rejection near $326. The token subsequently fell below the $300 support level and reached a low of $237.
A sustained move lower could bring the $195 area into focus as the next major support level. Further selling below that zone would place greater attention on the $150 level identified by EGRAG Crypto.
On the upside, QNT would need to recover the $300 area before traders could assess another move toward the recent high.