streamoors
 IGNITION
 Quantus
 Sui
Sui Zcash
Zcash Ethereum
 Pearl
Pearl

Solana price held near $120 on Oct. 6 after a trader opened a $19.78 million leveraged long. The move came as SOL traded inside a rising daily channel and near trendline support. Fresh decentralized exchange data also showed Solana leading weekly spot activity among major chains.
The setup matters because leveraged positioning now overlaps with elevated on-chain turnover. That combination can support momentum when spot demand persists. It can also increase downside pressure if price loses nearby support and forces leveraged positions to unwind.
Solana Price Holds Near $120 After Recent Advance
TradingView data from the supplied Coinbase chart showed SOL near $120.37 on Oct. 6. The daily candle ranged between $118.87 and $121.28 before the screenshot time. Price remained above the chart’s rising lower trendline after September’s sharp advance.
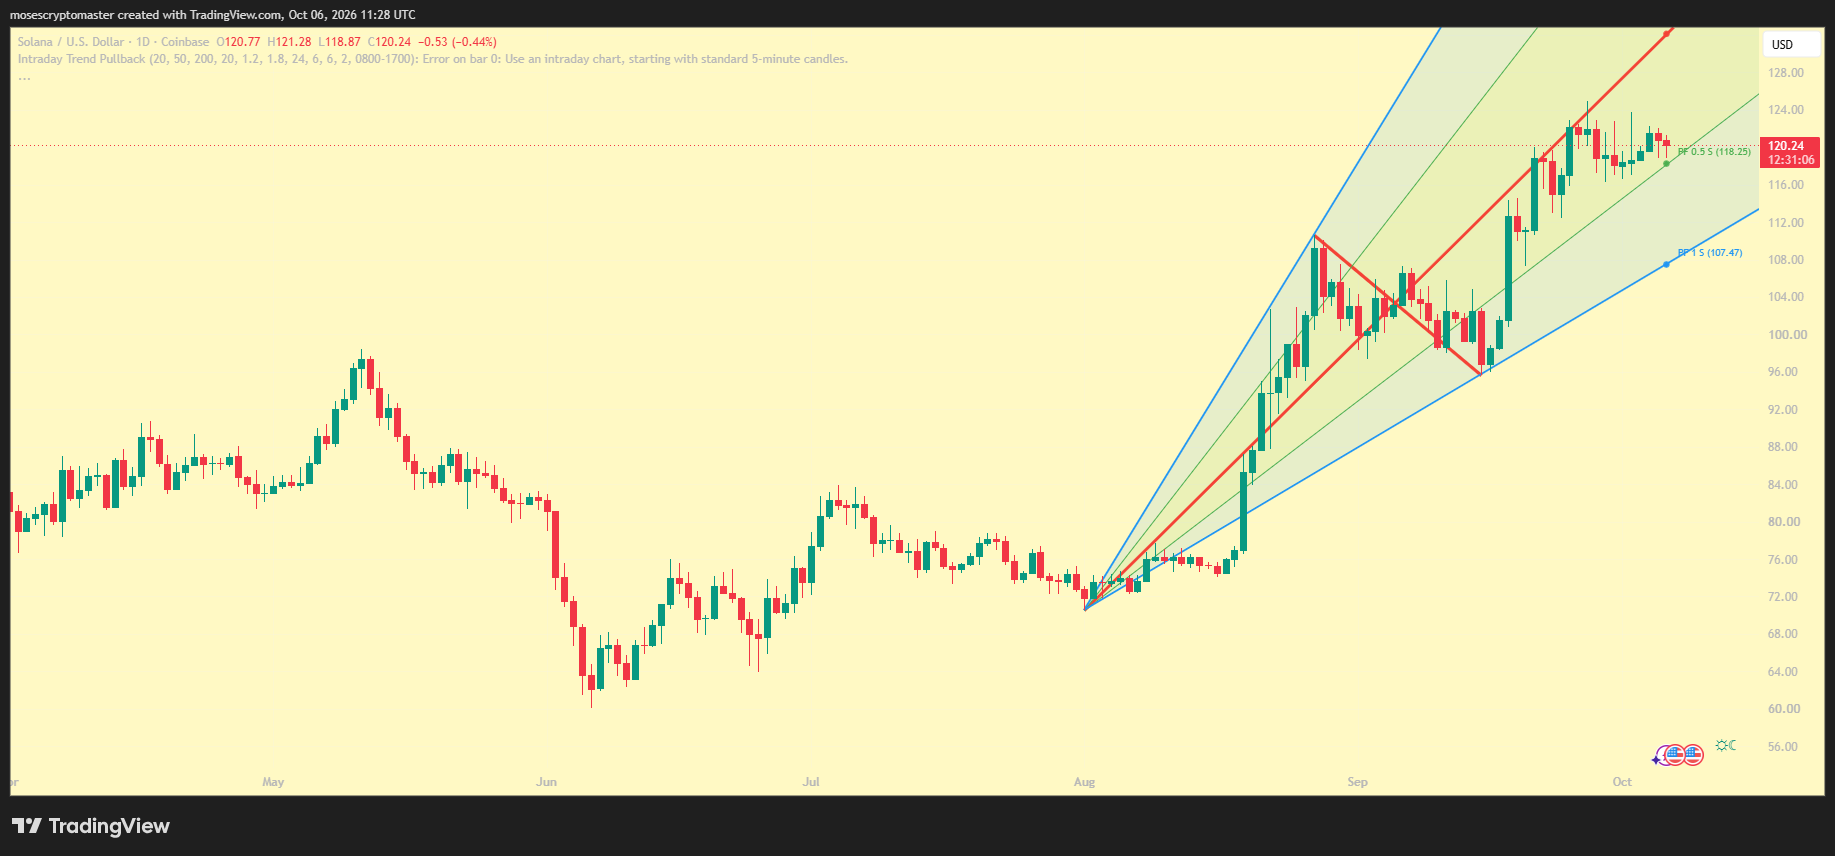
The solana price had already climbed from roughly $72 in early August. TradingView’s chart showed SOL reaching the low-$120 area before entering a tighter consolidation. That left traders watching whether buyers could defend the $118-$119 region.
Volume behavior around that zone could clarify whether buyers were absorbing short-term selling pressure. The chart also showed a broader ascending channel extending from August lows. Price stayed in the upper half of that structure.
Recent candles showed repeated rejection near the $122-$124 region on TradingView. That behavior kept short-term resistance close to current price. Buyers had not yet established a daily close above that cluster.
Solana Price Tests Trendline With $126-$127 Resistance Ahead
Trader SatoshiOwl said the preferred entry sat near $119. The trader placed a stop below the trendline and targeted $126-$127. That setup treated current support as the main level separating continuation from a deeper pullback.
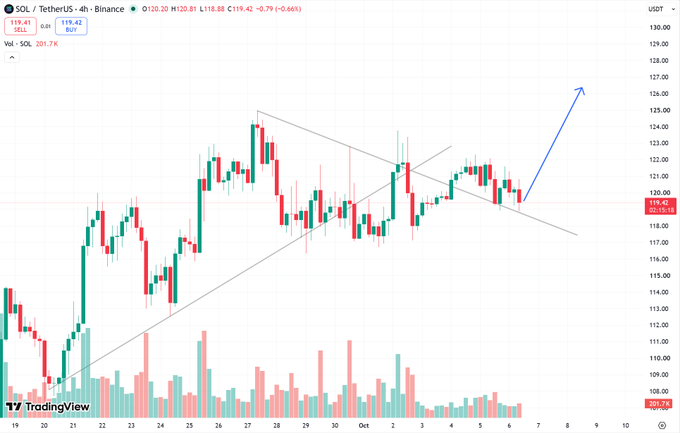
The solana price therefore faced a relatively narrow technical decision zone. Holding the rising trendline would preserve the channel structure. A move through $126-$127 would test the latest local highs shown on the daily chart.
TradingView’s chart also marked a lower support reference near $107.47. That level sat well below current price and close to the channel’s lower boundary. Losing $118 first would increase attention on that deeper support area.
The September structure also showed higher lows after an early-month pullback. That sequence remained intact at the screenshot time. A lower daily low would weaken the structure before any test of $107.47.
Solana Price Draws Leveraged Whale Positioning
Lookonchain reported that trader 0x13da opened a 5x long using 164,642 SOL. The position was worth about $19.78 million when the post appeared. Lookonchain also placed the liquidation price at $99.68.
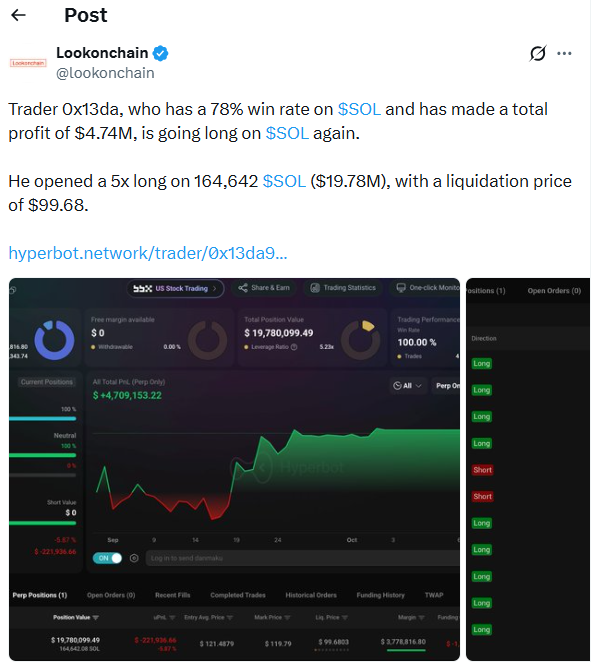
The account said the trader had a 78% SOL win rate. It also attributed $4.74 million in cumulative profit to the address. Those figures remain wallet-specific and do not establish broader market direction.
The solana price still faces added volatility from leverage around nearby technical levels. A decline toward the liquidation zone could increase selling risk. A sustained move above resistance would instead reduce immediate pressure on the position.
TMA also described the same long as a 164,642 SOL position using 5x leverage. Its post placed the value near $19.76 million. The small difference reflected SOL price movement around the posting times.
DEX Activity Adds Another Solana Price Catalyst
SolanaHub said Solana processed $18.28 billion in spot decentralized exchange volume from Sept. 28 through Oct. 4. The post compared that with $7.58 billion on Ethereum and $5.77 billion on Base. It also cited $5.23 billion for Robinhood-linked activity.
Whale Factor separately said Solana led quarterly decentralized exchange volume for eight consecutive quarters. The post did not provide its underlying dataset. That limits independent assessment of the longer-term comparison.
The official Solana account also shared comments from Helius chief executive Mert Mumtaz. He said Solana’s “long tail” supported varied on-chain use cases. Mumtaz cited memecoins, stocks and new startups as examples.
For the solana price, the next chart levels remain $118-$119 support and $126-$127 resistance. A daily close outside that range would provide a clearer directional signal. Traders will also watch whether DEX activity and leveraged positioning persist during coming sessions.