Dacity Coin
 Celestia
 Solana
 Injective
 Quantus
 Sei
Sei Pudgy Penguins
Solana price has formed an ascending triangle on the monthly chart as analysts watch for a potential breakout. The top altcoin has also reacted to support within a shorter-term rising channel. Meanwhile, Solana’s real-world asset (RWA) market capitalization climbed to about $4.3 billion over the past year. Castle Labs places the network ahead of Ethereum and Hyperliquid in 30-day application revenue.
Solana Price Forms Ascending Triangle on Monthly Chart
Crypto analyst Crypto Xlarge identified an ascending triangle in SOL price prediction. The pattern features a rising support line connecting higher lows since 2023 and a horizontal resistance area near $250. Price has approached that upper boundary several times without establishing a breakout, while buyers have defended higher levels along the lower trendline.
Analyst Ash Crypto described the formation as a bullish triangle and pointed to another upward move if SOL crypto clears resistance. For now, the converging trendlines show tightening price action rather than a completed breakout. A monthly close above the upper boundary would offer stronger confirmation.
The monthly relative strength index (RSI) adds another level to watch. RSI has followed a descending trendline drawn from its 2024 peak, although the latest reading has moved back toward 50. A move through that downward trendline would mark a change in the indicator’s recent direction.
SOL Price Tests Rising Channel Support
A separate daily analysis from More Crypto Online tracks SOL crypto within an upward-sloping price channel. The latest chart places the token near $105.53 after it reacted higher from the channel’s lower trendline. The move follows a pullback from the October high near $125.
The analyst identified $106.79 as a nearby Fibonacci level, followed by $96.89 and $89.57 further down. These levels give traders reference points as SOL moves around the lower part of the channel. The chart also marks overhead resistance around $110, with a resistance region near $135.
Continued trading above the ascending support line would keep the daily channel structure intact. A drop below that boundary would put the lower Fibonacci levels into focus.
Solana RWA Market Cap Climbs Above $4.3 Billion
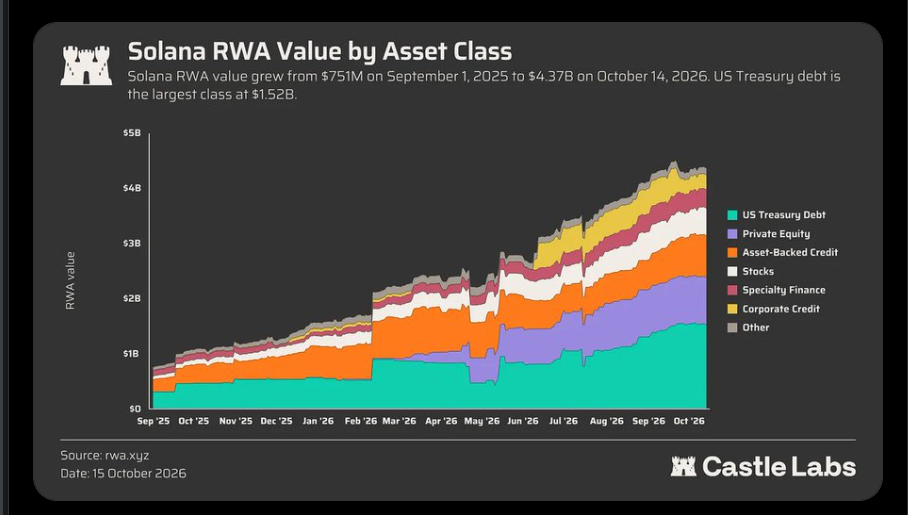
Solana’s on-chain RWA market capitalization increased from roughly $700 million to $4.3 billion in one year. That represents an increase of approximately $3.6 billion.
A separate asset-class breakdown put the total at $4.37 billion on October 14, up from $751 million on September 1, 2025.
US Treasury debt accounts for the largest category, at about $1.52 billion. The remaining value spans private equity, asset-backed credit, stocks, specialty finance, corporate credit and other tokenized assets. The report tracks these assets separately from conventional stablecoins.
Ethereum’s RWA market grew from $15.5 billion to $16.6 billion during the comparison period. Solana’s RWA market therefore increased from approximately 4.5% to 26% of Ethereum’s total. Ethereum still holds the larger market by value, while Solana recorded faster growth from its smaller starting base.
Solana Application Revenue Reaches $193.1 Million
Castle Labs reported $193.1 million in Solana application revenue over the preceding 30 days. The network ranked first among the blockchains in the comparison, ahead of Hyperliquid at $86.5 million and Ethereum at $53.8 million.
Application revenue measures earnings generated by applications operating on a blockchain, rather than the market capitalization of its tokenized assets. The two datasets cover different activities within the Solana ecosystem.
This article is for informational purposes only and does not constitute financial or investment advice.