
 streamoors
 Altai the Tiger
 Sword Inu
 IGNITION
 no crying in the casino
 Quantus
 Pearl
Pearl

Key Insights:
- Bitcoin closed below $80.6K, turning former support into new resistance amid rising selling pressure.
- RSI and price downtrend failures suggest weakening momentum and a lack of bullish confirmation signals.
- The weekly structure remains bullish if BTC holds above $74.8K, backed by a multi-year inverse head and shoulders pattern.
Bitcoin price has struggled to reclaim $80,670 after losing it as weekly support. This raised questions about the market’s short-term trajectory.
Although technical patterns hint at bullish potential, BTC faces risks. The price could drop toward the $70,000 zone if it fails to recover key levels.
Bitcoin Price Trapped Below Resistance as $80.6K Flips Bearish
Bitcoin price closed last week under $80,670, a level that had served as support since early March. Analysts argue that this close has turned former support into resistance, with recent upside wicks confirming rejection from this zone.
“Bitcoin has Weekly Closed below the early March lows of $80,670,” wrote one analyst. The analyst added that the price upside-wicked into this zone, forming a fresh CME gap that now acts as resistance.
According to chartist Captain Faibik, BTC is still confined to a falling wedge pattern during the daily timeframe. He expects the price to retest the $85,000 mark before facing heightened selling pressure.
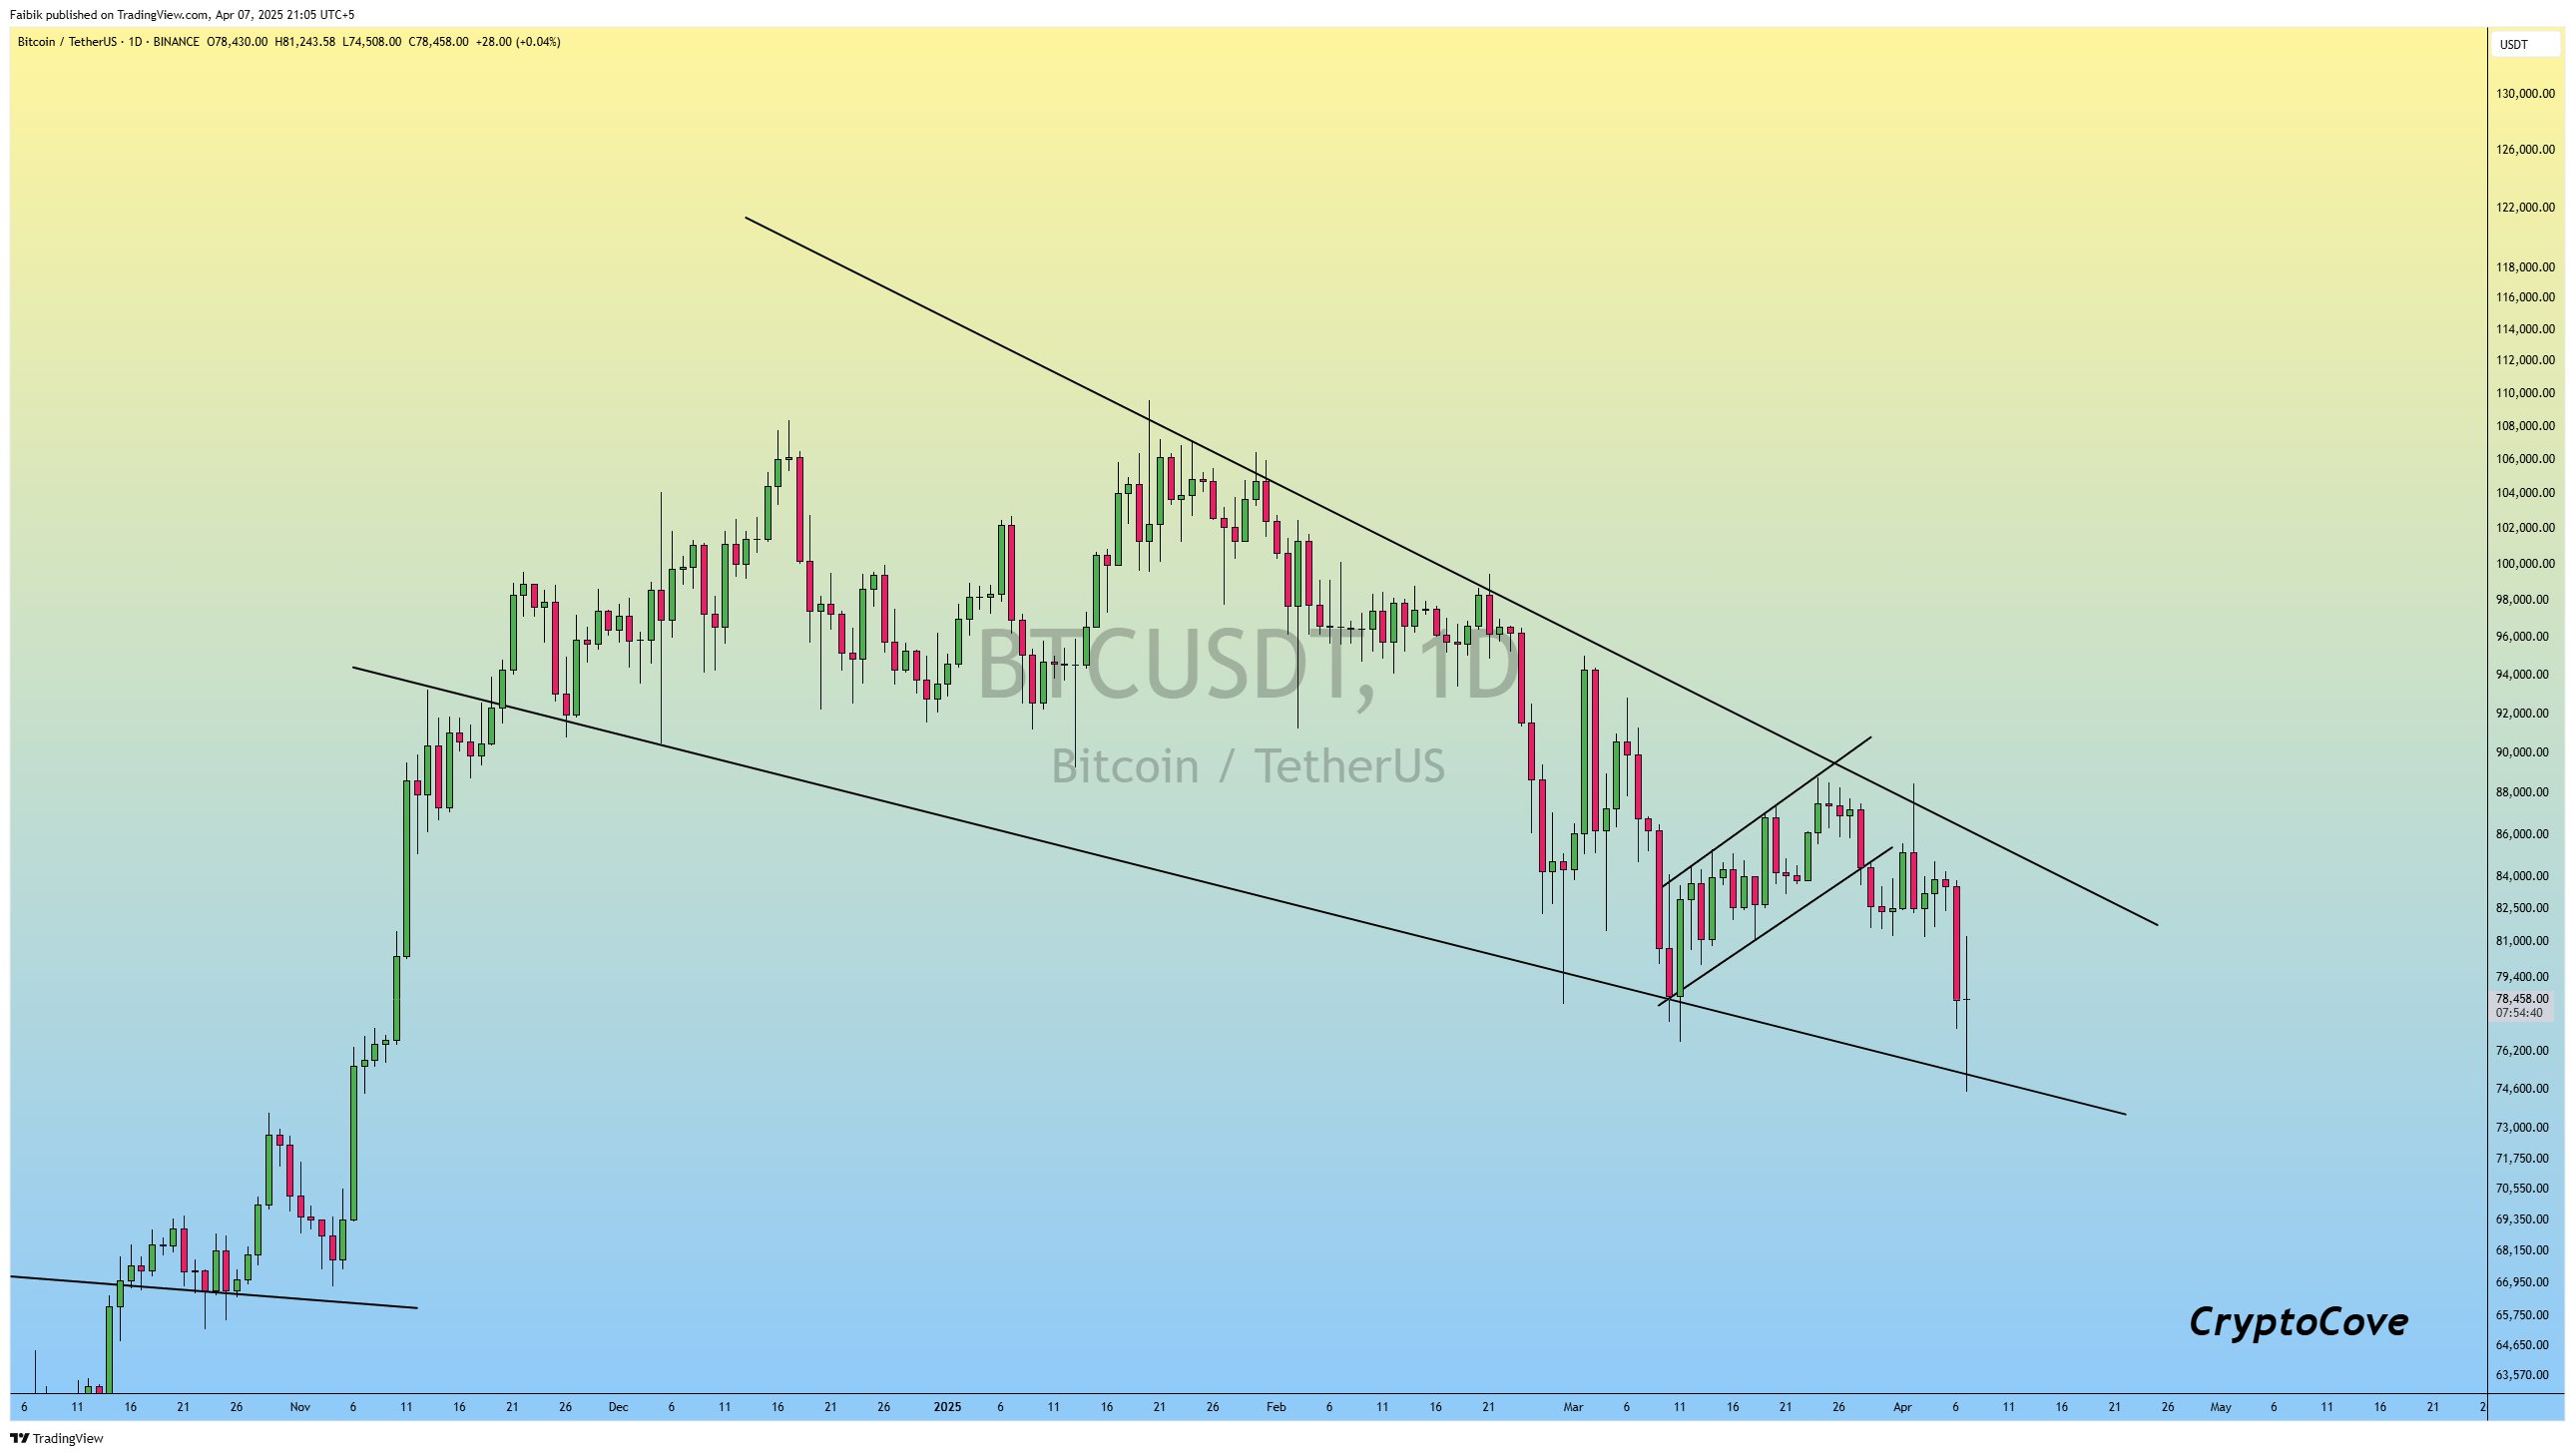
So far, Bitcoin price has failed to break above its descending trendline. The daily RSI also remains trapped below its downtrend line.
This dual failure has intensified short-term bearish momentum. The situation worsened after BTC closed below the March lows of $78,500.
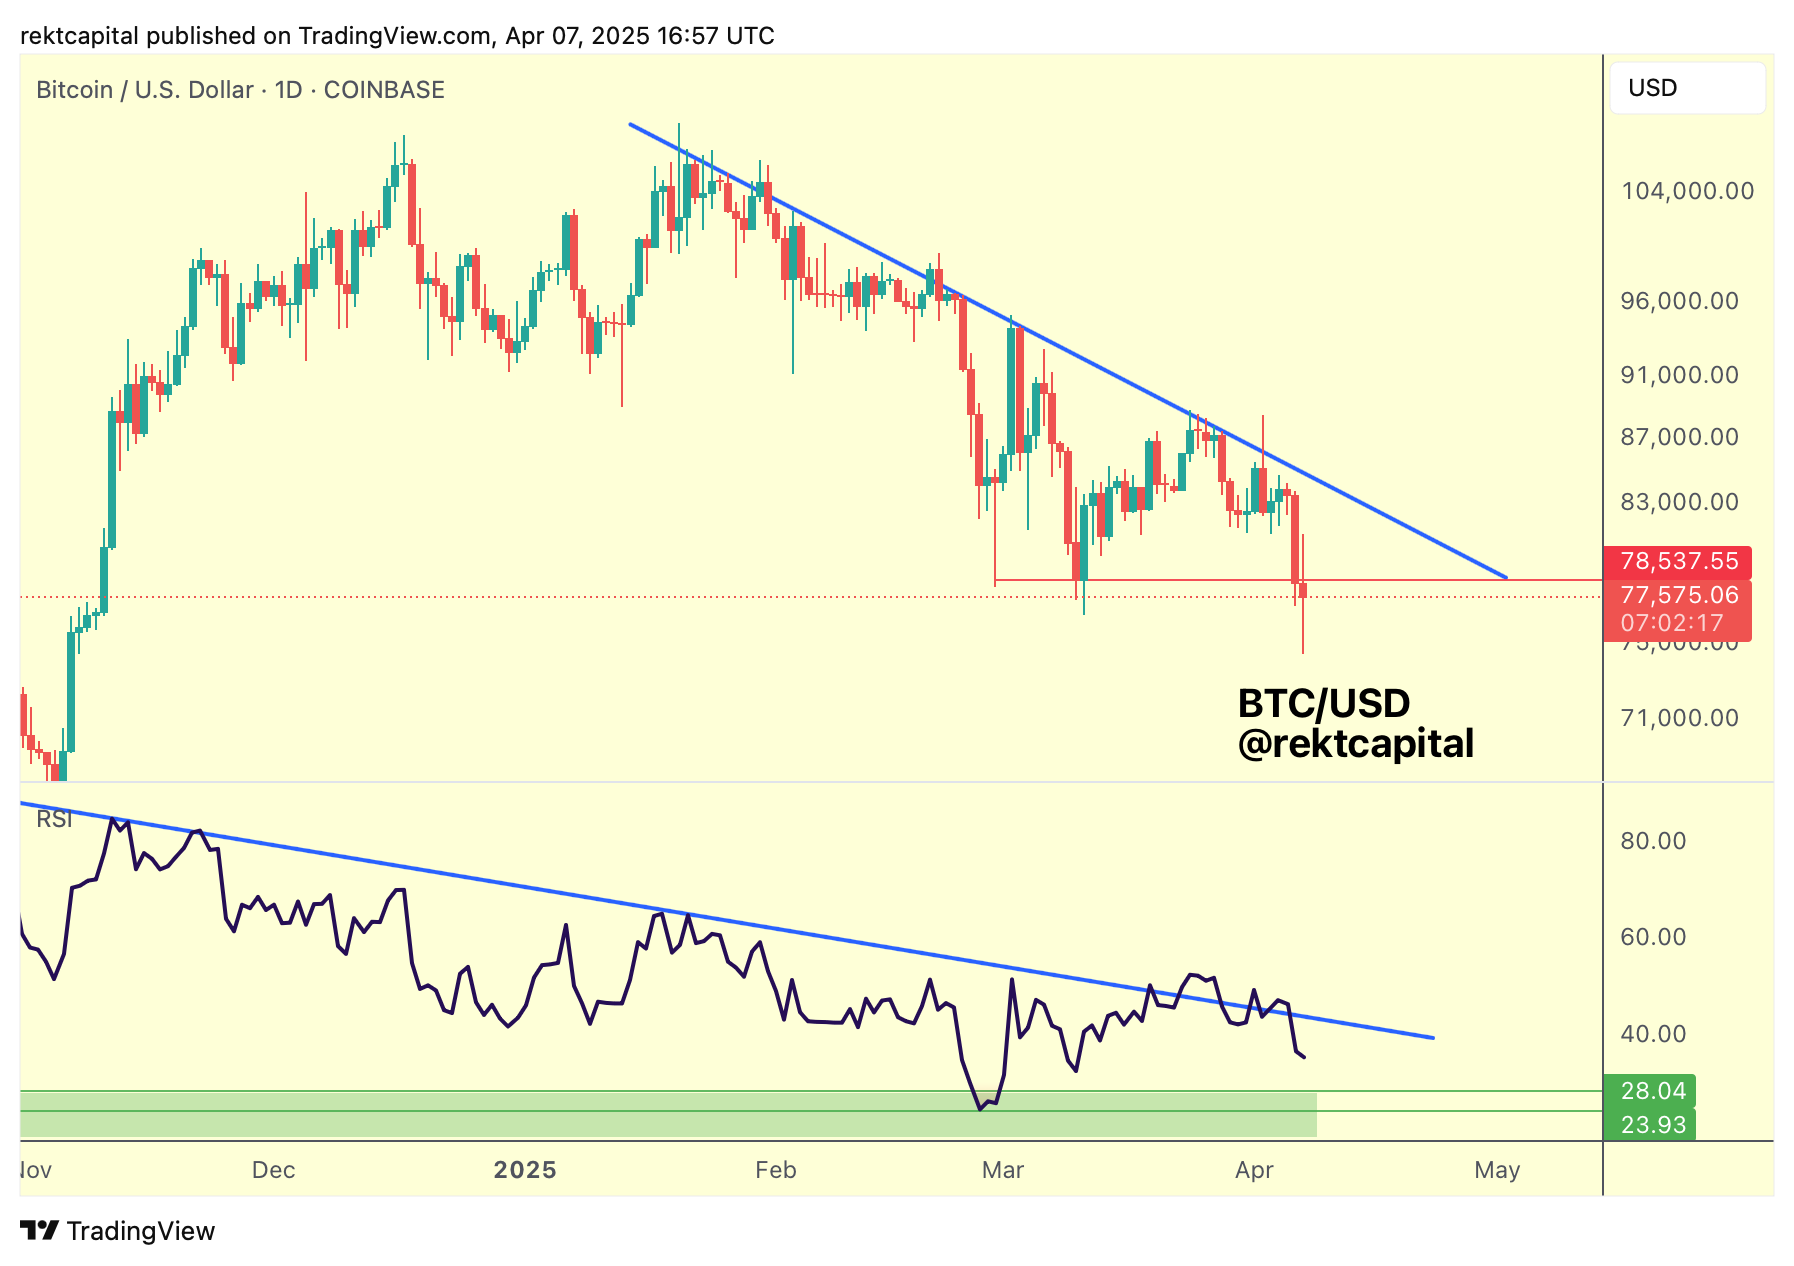
Historical RSI behavior provides little comfort. In previous cycles, the RSI showed bullish divergences with higher lows. However, it was only after BTC that two different lower lows emerged.
A similar setup now implies a potential move down toward $70,000. This coincided with the pre-halving highs and the top of the previous reaccumulation range.
$70K Becomes a Target as Market Structure Weakens
The current lower low sits 2.79% beneath its predecessor. In prior cycles, the second low often extended as deep as -8.44% below the first. If this historical range repeats, Bitcoin price may revisit $70,000.
More critically, this level represents the post-halving reaccumulating range. It is a zone that previously acted as a springboard for further rallies.
Price wicking into this area would not be unprecedented. BTC did something similar in mid-2023 when it briefly dipped below the range of early 2023.
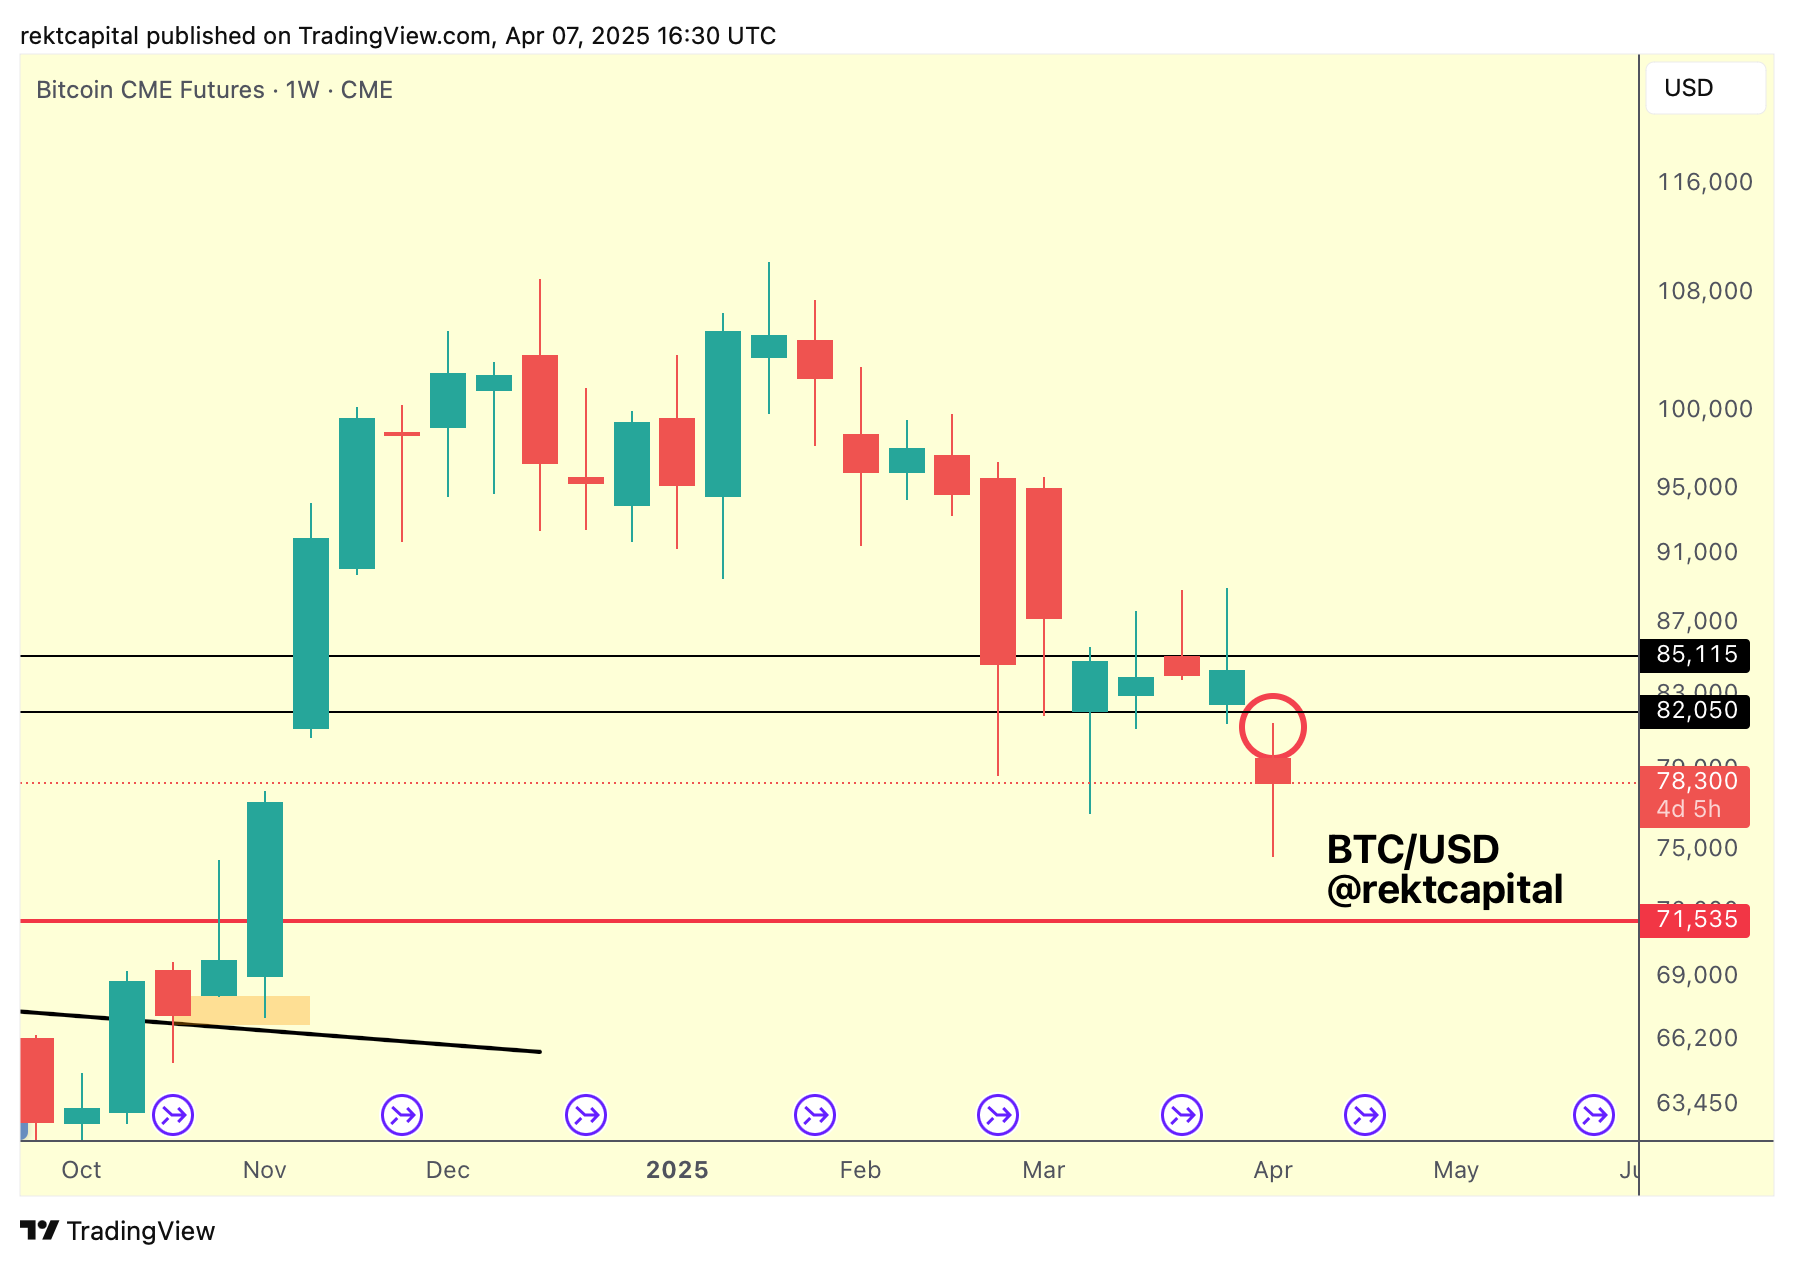
The recent breakdown from a CME gap-driven sideways range has exacerbated this weakness. Price promptly filled the newly opened gap. However, it failed to reclaim it as support. Instead, it is now rejecting from that level, confirming it as resistance.
“Bitcoin needs to reclaim $80,670 to position for a challenge of the Weekly Downtrend,” one analyst wrote. Without such a move, downside continuation remains the base case.
Bullish Setup Intact Above $74.8K, Says Gert van Lagen
Despite local weakness, some analysts maintain a bullish macro outlook. Gert van Lagen believes Bitcoin price remains in a multi-year bull market, targeting $300,000.
He bases this on a 4-year-old inverse head-and-shoulders (H&S) pattern, recently confirmed by a bounce off its neckline.
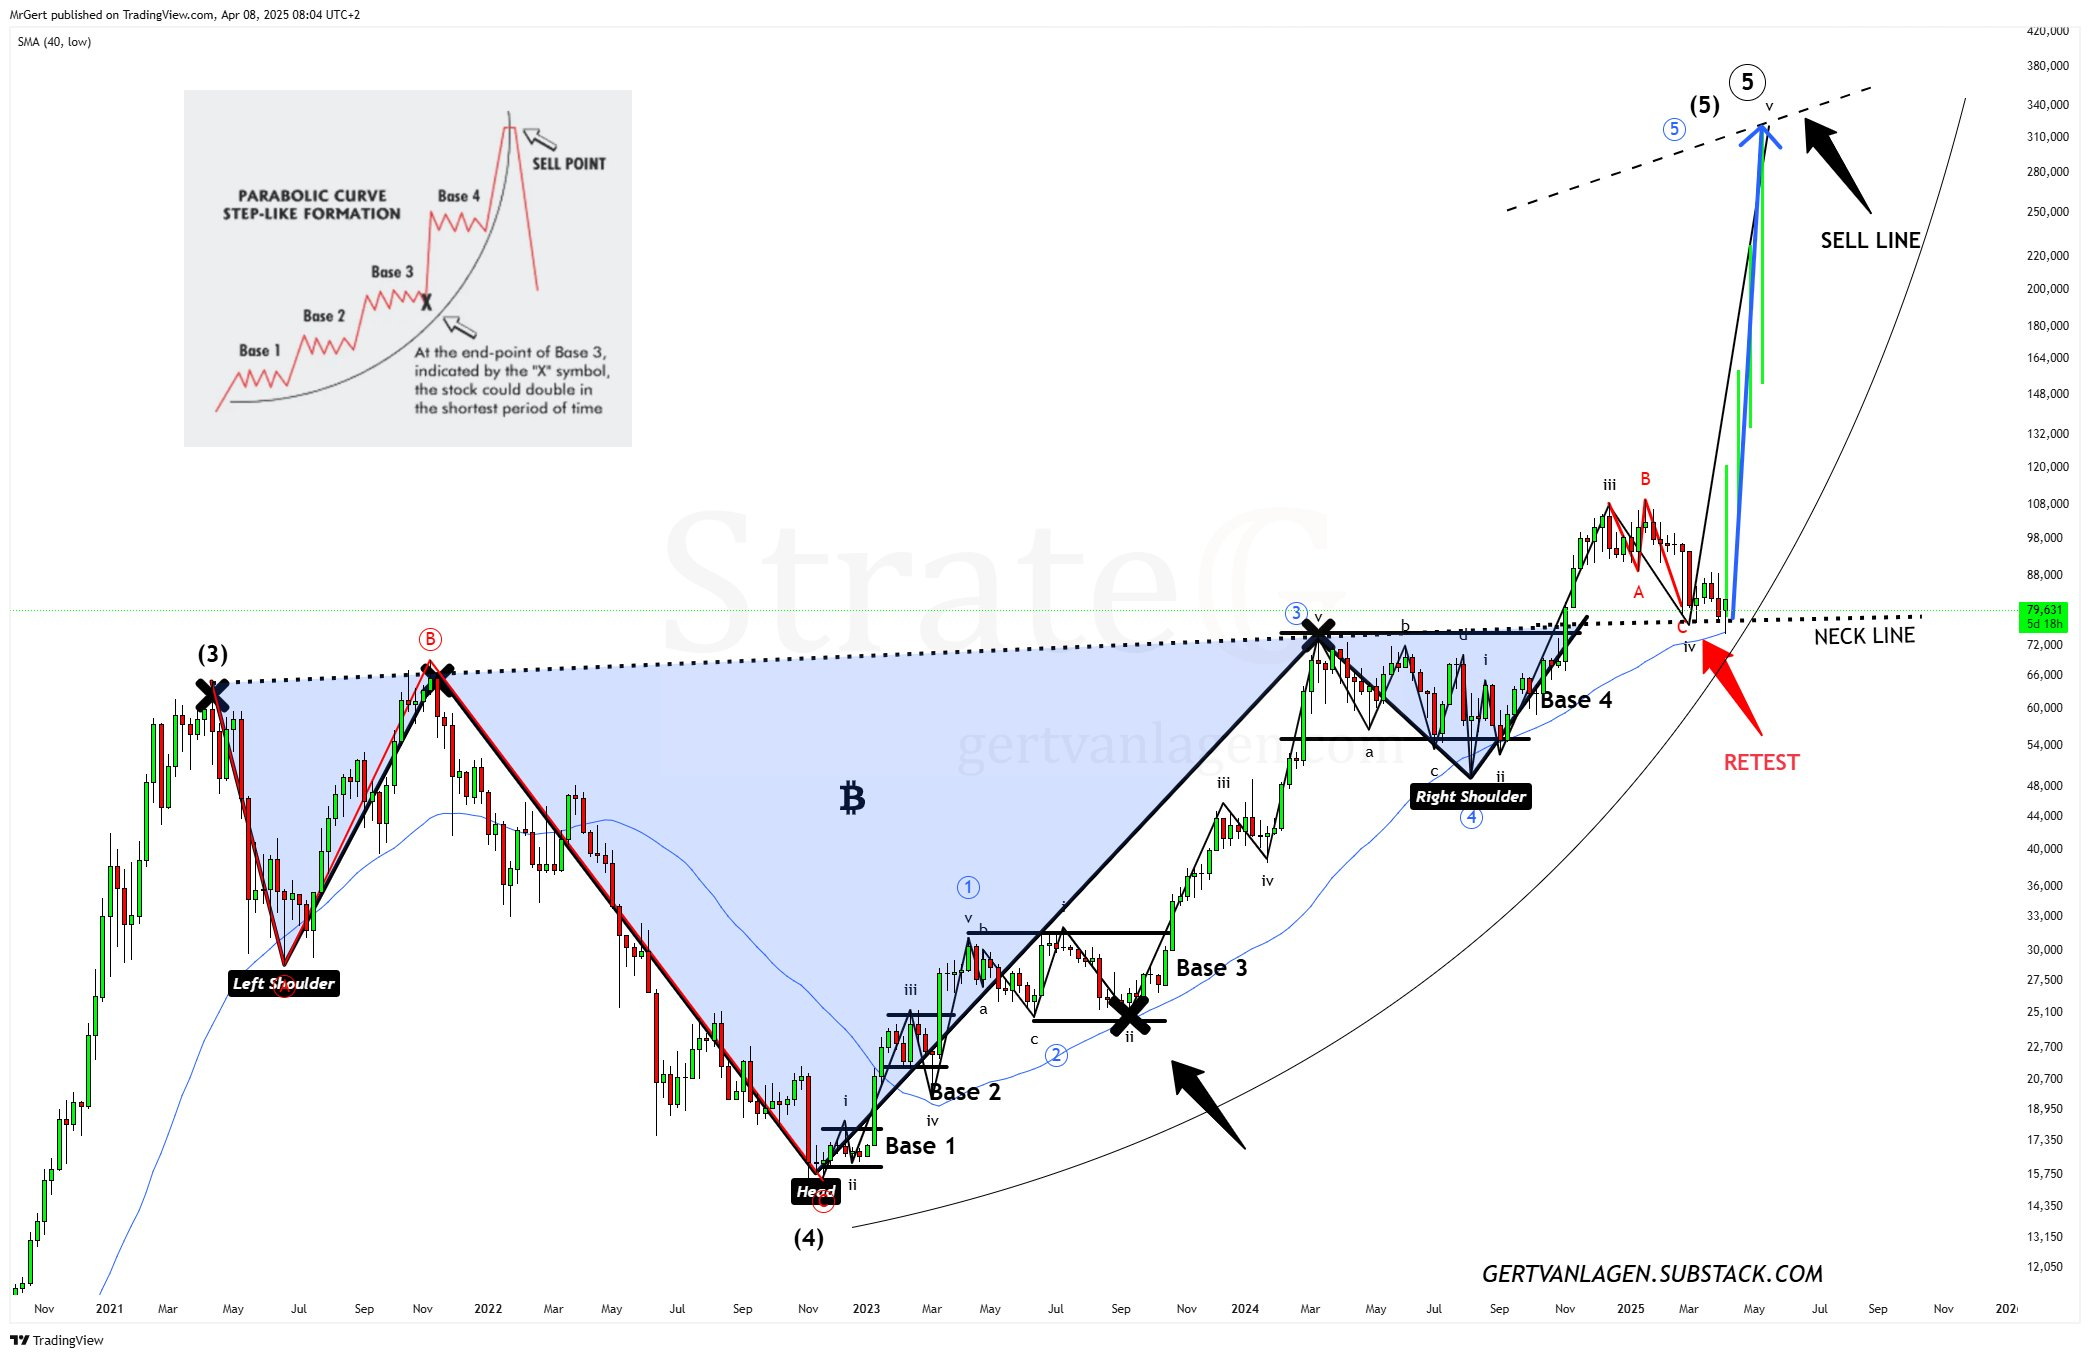
“BTC is continuing its bull market after bouncing off the neckline,” he wrote on April 8. He places invalidation at a weekly close below $74,800. This served as key support during the recent correction.
The chart highlights a parabolic curve with five significant bases. It predicts a final surge that could challenge the psychological six-figure mark.
The recent retest of the neckline confirms an ongoing bullish structure as long as BTC price stays above $74.8K. Intra-week volatility has yet to invalidate this macro thesis.
However, should BTC lose the $74,800 level, the entire formation could unravel, introducing new bearish risks.
HTF Demand Zone Still Holding, Says CrediBULL Crypto
CrediBULL Crypto points to a developing three-drive pattern on the daily chart. At the same time, the analyst emphasized the importance of the high timeframe (HTF) demand zone.
He also noted that the recent drop appears aggressive but hasn’t yet damaged the high-timeframe structure. He marked the origin of the ongoing wave at $59,000. This indicated that Bitcoin price still has room to test demand without breaking the bullish structure.
BTC is now squeezed between macro-bullish structures and short-term bearish technicals. Price action and RSI fail to confirm strength on one side, with CME gaps and resistance flips pointing lower. Conversely, long-term patterns and demand zones suggest a base could be forming.
The $80,670 level remains pivotal. A clean reclaim may give bulls another chance to push toward $85,000. Failure to do so could drag BTC to pre-halving highs near $70,000, with little support.
Disclaimer
This article is for informational purposes only and provides no financial, investment, or other advice. The author or any people mentioned in this article are not responsible for any financial loss that may occur from investing in or trading. Please do your research before making any financial decisions.



