
 Sword Inu
 streamoors
 Altai the Tiger
 no crying in the casino
 IGNITION
 Pudgy Penguins
 Quantus

Key Insights:
- SUI must close above $4.30 to invalidate the TD Sequential “9” sell signal on the 3-day chart.
- Fibonacci support at $3.07 and $3.62 remains intact, showing buyers are defending key retracement zones.
- Over $2.5M in short liquidations on May 10 triggered a major rally, pushing SUI above $3.50.
SUI entered a crucial price phase after a strong rally from mid-April to early May 2025. The token now trades below a key resistance at $4.30, the level required to nullify a sell signal from the TD Sequential indicator. Market participants remain alert as price consolidates beneath this threshold.
TD Sequential Sell Signal and SUI Price Structure
The TD Sequential printed a green “9” candle on the 3-day SUI/USD chart. This pattern often indicates trend exhaustion or a short pause in upward momentum.
SUI surged from $1.80 to $4.36, forming a five-wave pattern in Elliott Wave theory. As of May 18, SUI traded at $3.75, slightly below the critical resistance.
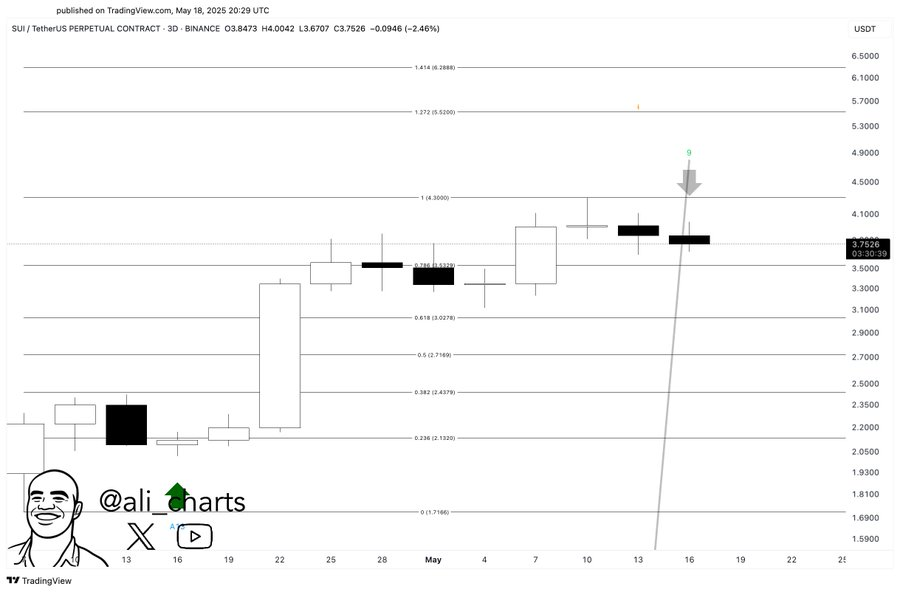
Ali Chart, a well-known crypto analyst, commented on social media, “SUI needs a candle close above $4.30 to invalidate the TD 9 signal. Otherwise, it could mark a local top.”
Fibonacci Levels and Support Zones
The recent rally has respected Fibonacci retracement levels drawn from the April low to the $4.36 high. SUI has remained above the 0.618 ($3.07) and 0.786 ($3.62) retracement levels. These zones are often seen as key support during bullish consolidations.
Price has been consolidating near the 0.786 zone. Traders are watching for either a bounce or breakdown from this level. A decisive move above $4.30 would suggest trend continuation, while a rejection could lead to a deeper pullback.
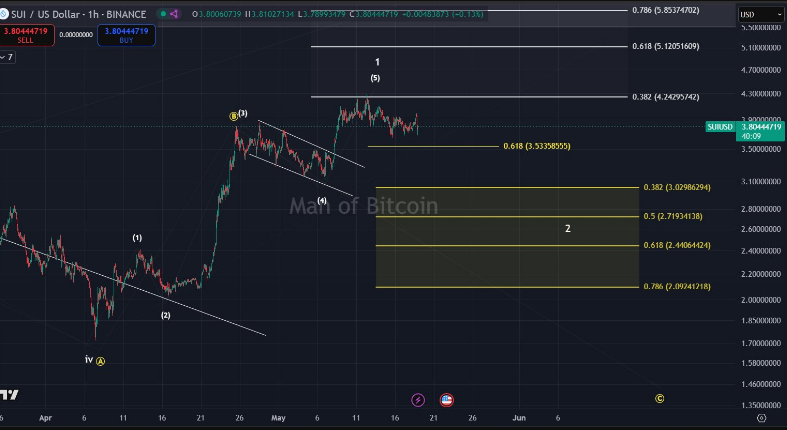
Current support lies between $3.02 and $2.09. This range is based on the expected zone for a wave-2 correction. If price drops below $3.00, selling pressure may increase.
Liquidation Trends and Market Volatility
Data from late April to mid-May shows sharp liquidation events on both sides. A large short squeeze occurred on May 10, with around $2.57 million in short positions liquidated. This move pushed the price quickly above $3.50, indicating aggressive covering by bears.
Following this, long positions were repeatedly liquidated during the $3.50–$3.80 consolidation phase. This suggests that some investors bought near the end and held too much debt. The liquidations in the range of $1–2 million each were long-lasting.
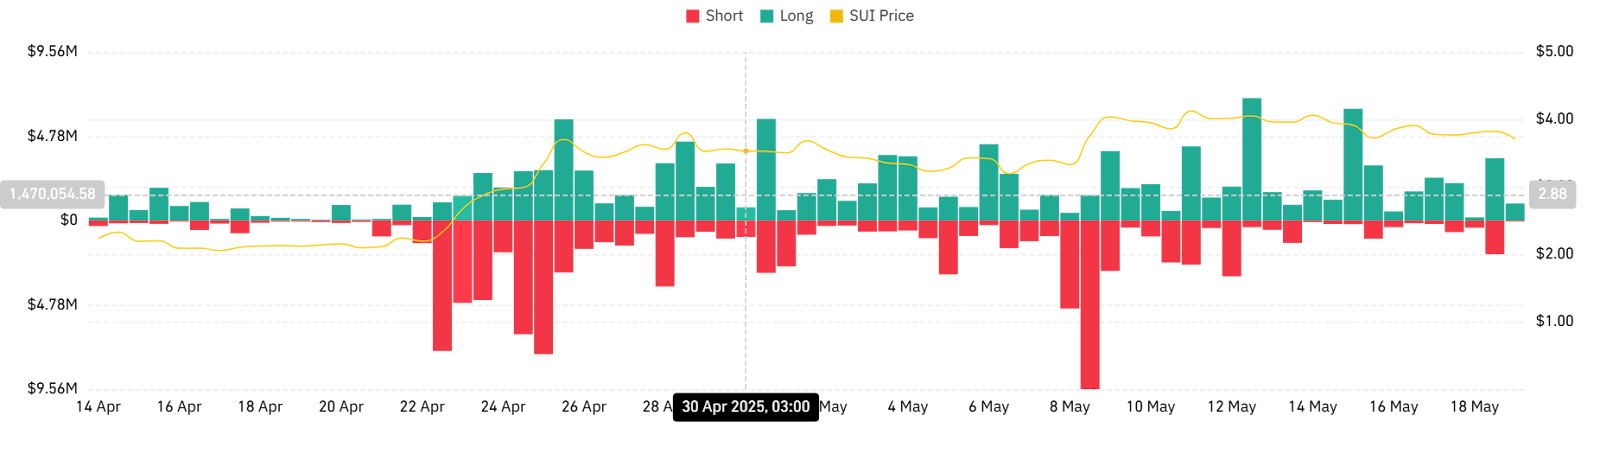
Liquidations keep occurring in fast succession, leading to large price swings. These arise from traders being more volatile and restless in their decision-making. Risk control appears to be lacking on both long and short sides.
Ecosystem Growth and Token Supply Dynamics
The DeFi environment in Sui is growing swiftly due to the rise in stablecoin activity. As of May 16, the stablecoin supply reaching more than $1 billion showed a 218% rise from what was seen six months before. This indicates that more people are using applications on the Sui blockchain.
Activity involving USDT, USDC, FDUSD and USDY stablecoins supports common tasks in crypto trading and lending. DeFi is growing rapidly, but there are still challenges related to the supply of its tokens. The daily burn program has meant that only 33.3% of all SUI’s 10 billion tokens are circulating so far.
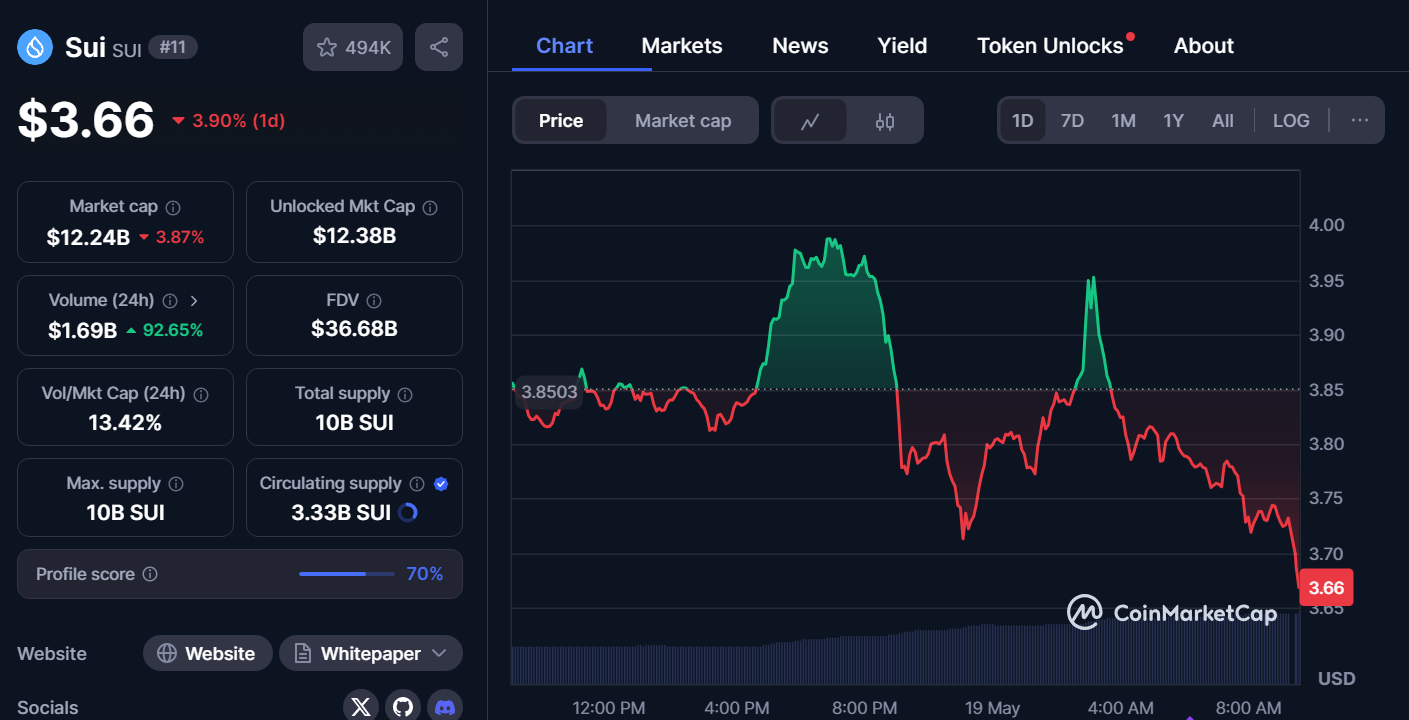
A significant portion of tokens are still being locked each day which could lead to more selling down the road. The market cap at the time of writing is only $12.3 billion, while its actual value could reach $36.87 billion. If the demand for the asset does not rise, additional tokens could cause more downward pressure on the price ahead.
Disclaimer
This article is for informational purposes only and provides no financial, investment, or other advice. The author or any people mentioned in this article are not responsible for any financial loss that may occur from investing in or trading. Please do your research before making any financial decisions.




