
 streamoors
 IGNITION
 Injective
 Quantus
 NEAR Protocol
 Pearl
Pearl LayerZero

Key Insights:
- Ethereum price structure mirrors Bitcoin‘s 2020–2021 breakout pattern, suggesting a potential rally.
- Ethereum has established strong support at $2,370 with minimal resistance above, signaling bullish technical conditions.
- Weekly active Ethereum addresses hit 15.65 million, indicating rising network activity and user engagement.
Ethereum price movement is reminding analysts of Bitcoin’s past surges. Technical indicators suggest a potential bullish trend.
Increased transfers and network activity indicate growing interest. This momentum could drive further ETH price gains.
Ethereum Price Structure Echoes Bitcoin’s 2020 Pattern
Ethereum price has experienced similar patterns to Bitcoin’s 2020–2021 cycle. ETH has been moving within a symmetrical triangle pattern. It has formed higher lows, indicating upward pressure, but faces resistance from a falling upper trendline.
A breakout in either direction could signal the next significant move. The pattern looks quite similar to the one that occurred before Bitcoin reached over $60,000 in early 2021.
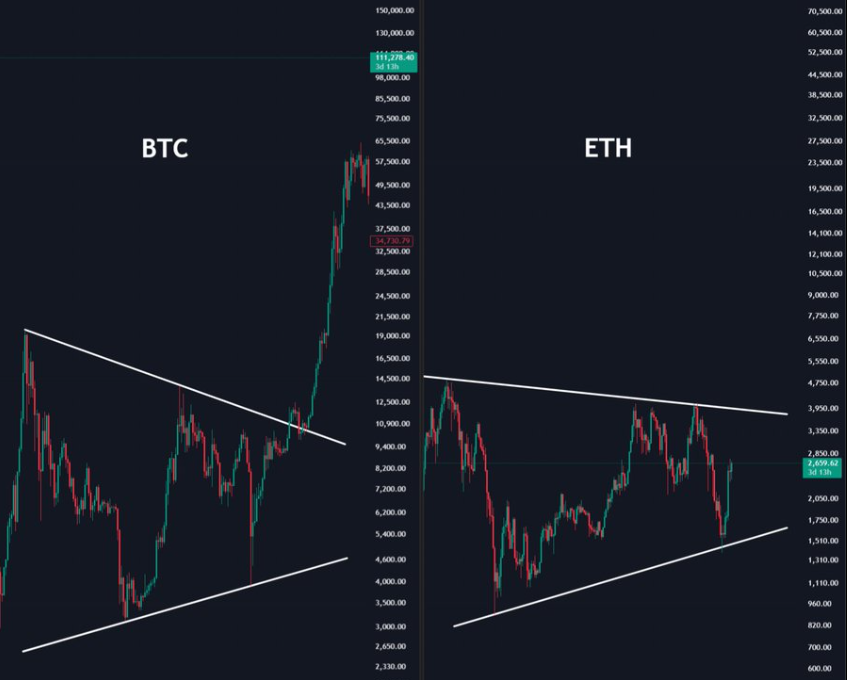
After a long accumulation period inside a triangle, Bitcoin experienced a sharp price rise. Ethereum is now in a similar position in its cycle. Ted Pillows noted that if Ethereum price attempts this pattern and breaks resistance, significant price rises could follow shortly.
Ethereum Price Found Support at $2,370
A solid level of $2,370 now supports the ETH price. IntoTheBlock data revealed that approximately 6.5 million ETH were purchased between $2,293 and $2,379 by 2.16 million different wallet users.
Consequently, the altcoin price range formed a zone where many buyers are interested, giving support against dips.

When writing, the Ethereum price was trading above $2,577, a good support position for the top altcoin. Ali Martinez believes ETH could climb more easily since there’s no significant resistance above its current price.
This absence of obstacles may allow a smoother upward movement. These moves on the chart look similar to those seen before substantial price increases. According to Analyst Crypto Fella, the Ethereum price overall chart pattern indicates it may soon move upward strongly.
ETH has risen above a long-term trendline, building higher low points since 2020. Whenever this trendline crosses below the ETH price, it leads to a significant rally.
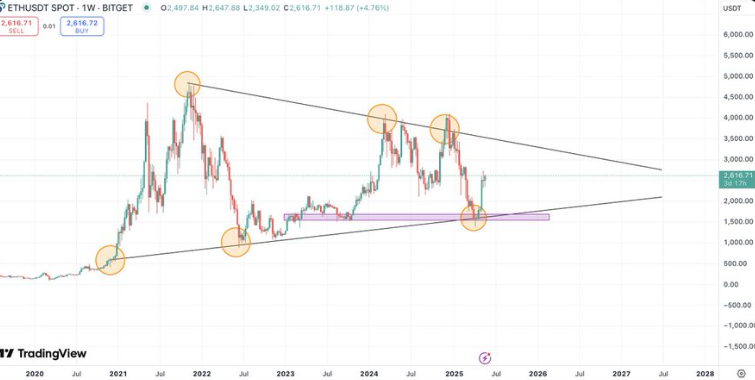
Additionally, the pattern resembled a large symmetrical triangle, with ETH trading near the support zone at around $2,500. Increased trading activity suggested that Ethereum is preparing for a breakout around the $3,500 level.
Weekly Active Addresses Reach Record Highs
Meanwhile, Ethereum on-chain activity has peaked, with 15.65 million weekly active addresses recorded in the latest data update.
It showed the peak of unique wallets involved with Ethereum in any week. More use of decentralized apps and more actions on smart contracts have led to increased network activity.
Data visualizations from growthepie.xyz revealed a sharp increase in activity. The trend gained momentum in mid-2023 and continued rising through Q2 2025.
Such increases have tended to happen before the market rises due to more users joining the network. Analysts consider this metric an early sign of continuing demand for the asset.
After 4 years of dormancy, an Ethereum whale sent 3.499 ETH to Kraken but still possessed $32.35 million in ETH. This movement suggested reassessing long-term holdings as Ethereum showed signs of renewed strength.
The wallet remained inactive during primary market cycles. This dormancy aligned with increasing price momentum and heightened network activity.
With the Ethereum price continuing to maintain its higher low structure, analysts are paying attention to potential breakout levels. A sharp price increase could follow if gold surpasses the $3,500 resistance level. Historical trends suggest such breakouts often lead to rapid escalation.
Disclaimer
In this article, the views, and opinions stated by the author, or any people named are for informational purposes only, and they don’t establish the investment, financial, or any other advice. Trading or investing in cryptocurrency assets comes with a risk of financial loss.




