
 streamoors
 IGNITION
 Injective
 Quantus
 Pearl
Pearl Aerodrome Finance
 NEAR Protocol

Key Insights:
- SHIB forms a bullish double-bottom pattern with a 115% upside target at $0.000025.
- Whale holdings drop to 17.92T SHIB, signaling cautious sentiment amid retail accumulation.
- SHIB futures volume jumps 10.89% to $112.85M, indicating renewed trader interest.
Shiba Inu has lost over 35% of its value since peaking in May, but technical patterns and growing trader activity suggest a recovery could be ahead. The SHIB price is forming a potential breakout structure, even as whales continue to reduce their holdings. Despite current market pressure, SHIB may rally toward a 115% gain, supported by trader sentiment, technical indicators, and macro trends.
SHIB Whale Activity Shows Continuous Sell-Off
Shiba Inu (SHIB) continues to face a steady sell-off from whale investors, despite showing signs of a technical recovery. According to Santiment data, addresses holding between 100 million and 1 billion SHIB tokens now control 17.92 trillion tokens, down from 18.8 trillion in December 2024.
Other categories have also reduced their holdings: wallets with 10 million to 100 million SHIB now hold 9.3 trillion, down from the year-to-date high of 9.44 trillion, while addresses holding between 1 million and 10 million SHIB have decreased from 2.07 trillion in February to 2 trillion currently.
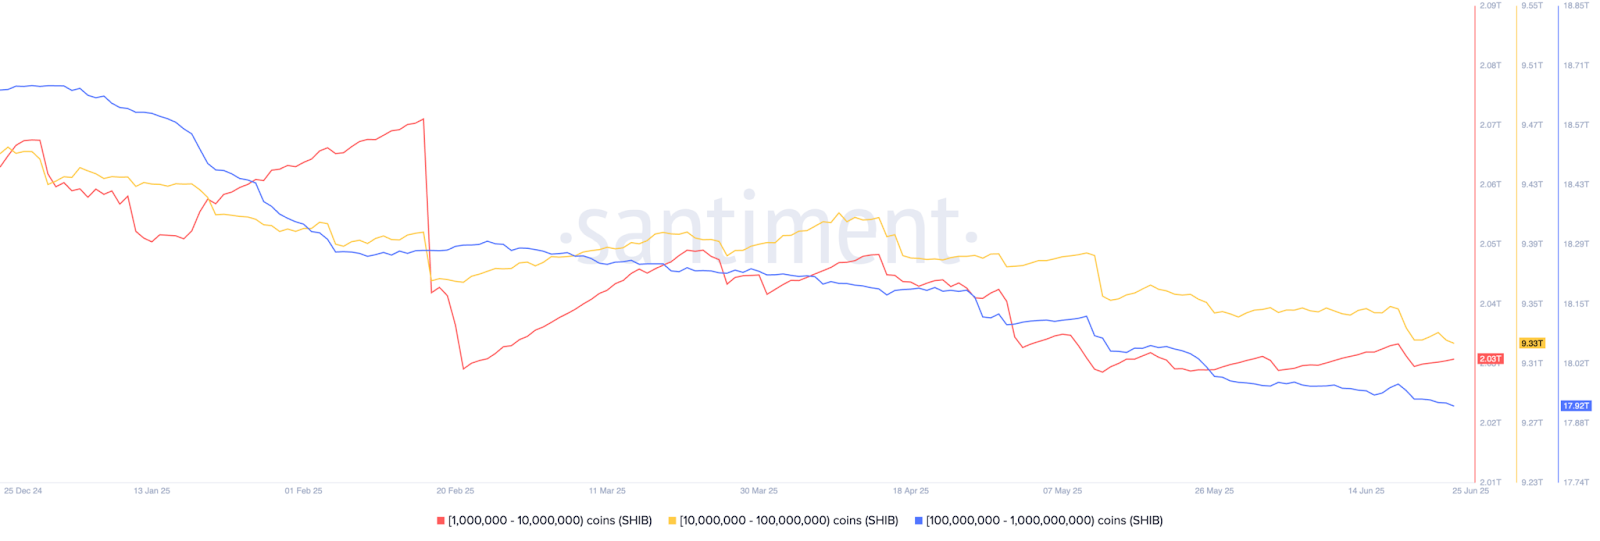
Whale capitulation is typically viewed as a bearish signal, as these large investors often have market-shaping influence and experience. Their selling may indicate caution and has historically led to more downside. However, retail traders and smaller investors might see this differently, especially if the market structure remains strong.
Despite the ongoing whale sell-off, SHIB’s technical recovery setup and price resilience suggest that the selling pressure is being absorbed by other participants. If Bitcoin rallies to a new all-time high, as many analysts expect, SHIB and other altcoins could benefit significantly, continuing their upward momentum.
Shiba Inu SHIB Derivatives Indicate Market Readiness
SHIB price activity in the derivatives market shows increased trading interest. Futures volume stands at $112.85 million, rising by 10.89% in the last 24 hours. While open interest has dropped slightly to $139.18 million, the rise in volume suggests new trades are replacing closed ones.
The platforms spread of long/short has a bullish edge. As shown by OKX, the ratio stands at 2.12, indicating that there are much more longs than shorts. Best traders on Binance are also long leaning. This indicates that there is upside in SHIB price expected by experienced accounts.
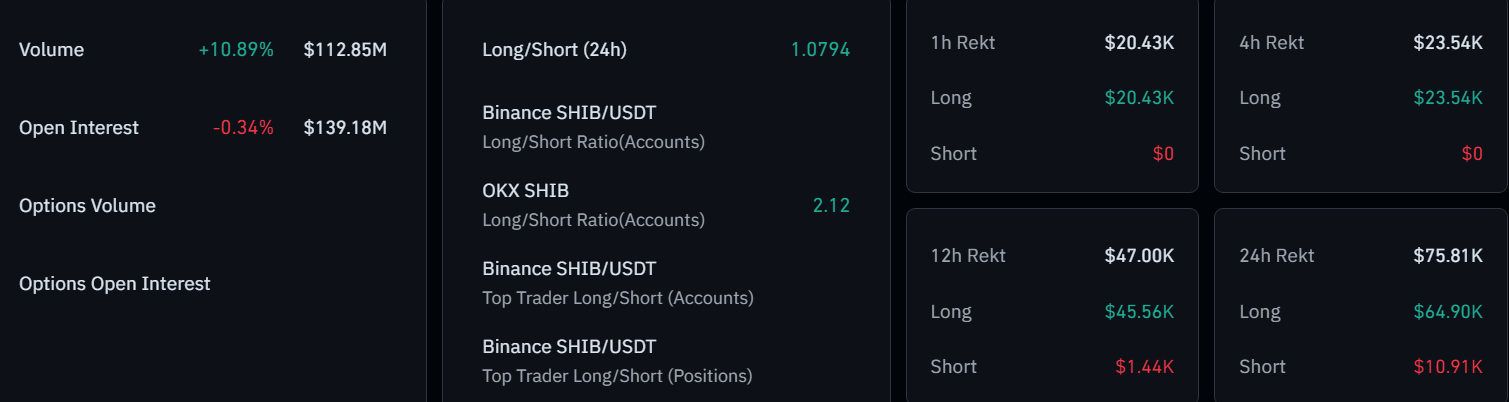
Liquidation data indicate it was mainly long positions that incurred majority of new losses. In the last 24 hours, 64.90K of longs had been liquidated in comparison to only 10.91K shorts. This trend could be a sign that some of the longs positions that were weaker have now been liquidated and there will be less immediate selling pressure.
Shiba Inu Price Recovers Amid Technical Pattern Formation
SHIB price is currently trading near $0.0000115, reflecting a mild bearish movement after failing to hold gains from its early 2025 rally.According to the chart of the 1-day timeframe, the token has not been going upwards but has been in a long-term decline indicating the creation of lower highs and lower lows.
However, relapse seems to be stabilizing on SHIB with the main support at the levels of $0.0000114 and resistance at the levels of $0.0000116 indicating the feeling of indecision in the nearest future.
Although the SHIB price has recently been weak, it has acquired a double-bottom structure with support offered by the price of $0.00001025 and a double-bottom neckline at $0.00001765.
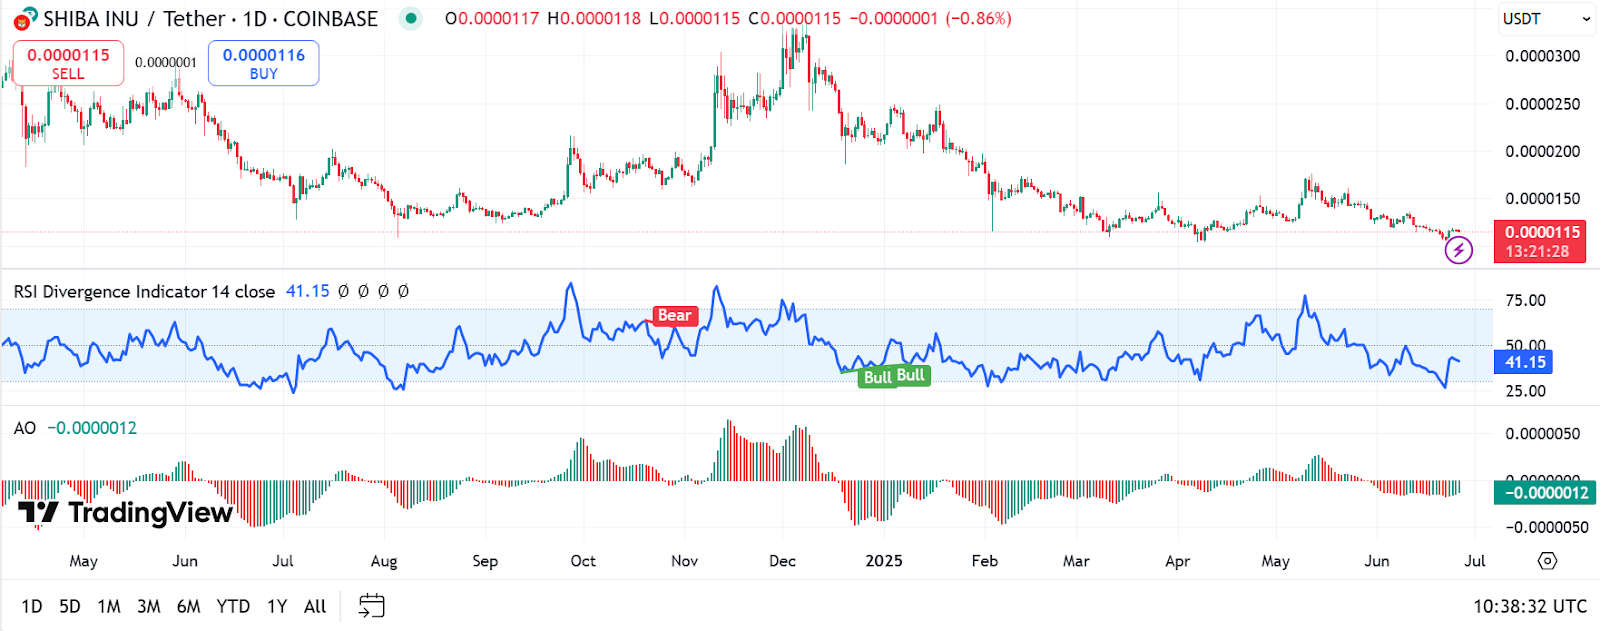
The pattern is usually one of the indicators of a possible bullish reversal in case the price breaks the neck line. This structure has a target measurement of approximately $0.000025 that will be a 115% move from the current price of $0.00001163.
The setup is supported by momentum indicators. RSI is in the recovery mode at 41.15 and has begun exerting bull pressure and the MACD shows that the crossover is bullish. The Awesome Oscillator is also becoming weaker as it suggests a decline in bearish momentum.
Disclaimer
This article is for informational purposes only and provides no financial, investment, or other advice. The author or any people mentioned in this article are not responsible for any financial loss that may occur from investing in or trading. Please do your research before making any financial decisions.




