
 streamoors
 IGNITION
 Sui
Sui Quantus
 Bitcoin
 Pearl
Pearl Solana
Shiba Inu (SHIB) price experienced a sudden 10,000% increase in token burn rate in 24 hours. New technical indicators accompanied this, which showed a probable price rally. Amidst rising buying pressure, analysts monitored the possibility of Shiba Inu price surging toward the $0.000032 level.
Shiba Inu Price MACD Divergence and Breakout Projected 180% Rise
Shiba Inu’s daily price chart diverges from the Moving Average Convergence Divergence (MACD), indicating a bullish scenario. The divergence appeared with SHIB registering lower lows and the histogram on the MACD registering higher lows.
Notably, this is a situation that traders sometimes consider to be a possible indication of price reversal. According to technical analyst Javon Marks, this divergence suggested that SHIB price could post a move of up to 180%, bringing its price near $0.000032.
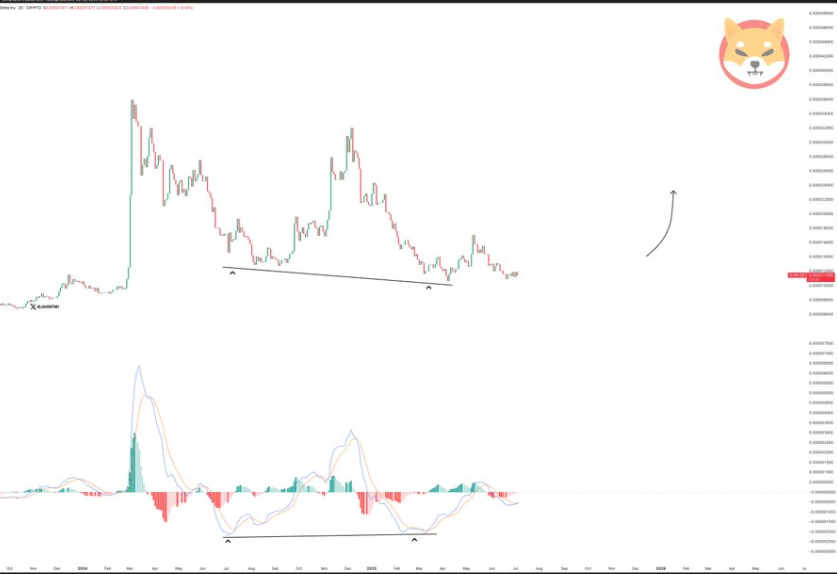
In addition, the MACD has also flipped to a positive bias, with signal lines crossing over and green bars beginning to appear. This technical configuration has previously been followed by strong upside trends for SHIB in past cycles.
In this context, the projected target of $0.000032 is a retracement back to a previous resistance area that was seen earlier this year, where the pricing had previously stalled before the ongoing downtrend started. This area could turn into a medium-term target provided volume does not change and momentum indicators sustain upside action.
SHIB Burn Rate Surged 10,000% in 24 Hours
According to Shibburn data, more than 8.8 million SHIB tokens have been burned in the last 24 hours, reflecting an increased burn rate of up to 10,000%. The burning mechanism, which minimizes the tokens, is an effective way to enhance scarcity.
Furthermore, the burn event is one of the biggest 24-hour tokens in SHIB in recent weeks. Consequently, this may raise the general community’s and market analysts’ interest.
This recent burn followed multiple smaller daily burns throughout the past week, which had cumulatively kept the rate relatively low. However, the sudden spike suggests a potential coordinated effort or an automated mechanism triggering the event.
Shiba Inu Price Broke a Key Trendline
Meanwhile, Shiba Inu price has been above a converging trendline on the charts over the past few months. On the 4-hour chart, SHIB consistently rejected downward pressure until a breakout occurred around the $0.00001120 region.
Besides, the breakout was met by a small consolidation, and a successful test of the broken resistance transformed into support. Such a pattern usually indicates a continuing trend when buyers maintain the momentum.
A chart posted by SHIB Mortal illustrated the breakout and a projected price path pointing toward $0.00001750. If that resistance is breached, the next psychological milestone is $0.0001.
Notably, SHIB price has previously tested this area during its late 2021 rallies, and market participants may view it as a longer-term target. The retest zone near $0.00001060 is expected to serve as an immediate support level, with any breakdown potentially invalidating the bullish setup.
Post-Breakout Structure Aligns With Historical Patterns
More so, according to the SHIB 2021 cycle, historical data indicated the same breakout patterns and remarkable rises. Charting Guy’s latest post compared the current consolidation and uptrend structure to past price surges that began from accumulation zones near $0.00000750.
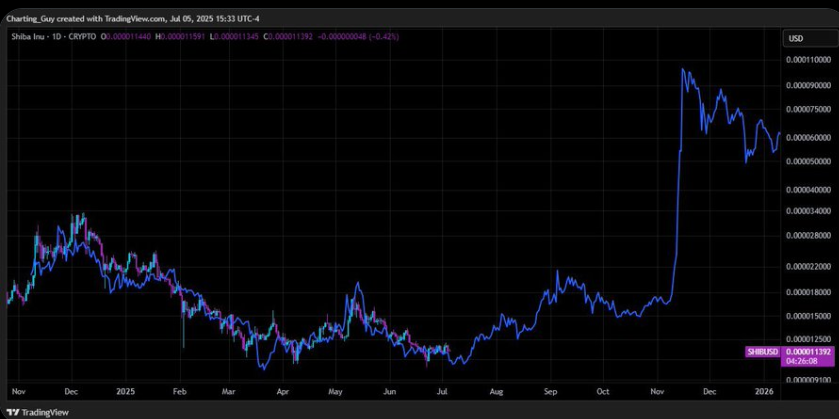
Subsequently, the chart showed a steep rise to over $0.00001000. It was followed by sideways movement, and then another sharp rally, a sequence currently repeating.
Moreover, the market’s reaction to the breakout was consistent with prior bullish continuation phases. Volatility remains elevated, and liquidity metrics show improved order book depth around support zones.




