
 astronaut
 Zylo Ecosystem
 Pearl
Pearl Bitcoin
 Quantus
 Pudgy Penguins
 Bitway

Key Insights:
- Bitcoin’s price increase triggers over $133.55 billion in large transactions.
- Institutional participation grows as large volume transactions surge on-chain.
- TVL growth supports the bullish momentum, reflecting increased capital deployment.
Bitcoin price momentum has been building in the market. This has led to the value of significant transactions in the network reaching a high of $133.55 billion.
This value surge is directly connected to the fact that the cryptocurrency is continuously surging. Also, the $BTC has already been sold at more than 119,000.
The increase in Bitcoin price can be seen on-chain, which has increased the number of traders abroad. It has performed high volume in the network and at a high level of wallets. Recent data shows that large Bitcoin transactions have shattered the $133.55 billion level.
Bitcoin Price Action Holding Strong Above $119K
$BTC stood at $119,042 at press time, a 0.59% gain in the previous 24 hours. Daily intraday price volatility remained moderate, with the Bitcoin price moving below $119K, before a later rebound.
The trading volume has also increased by 8.06% and currently stands at $79.03 Billion. This is a good sign that the market is becoming more active and confident.
The increased market cap has elevated Bitcoin to $2.36 Trillion with a growth of 0.6% in the same timeframe. This puts Bitcoin first in the world cryptocurrency market cap rankings. It was supported by a fully diluted valuation (FDV) of $2.49 Trillion.
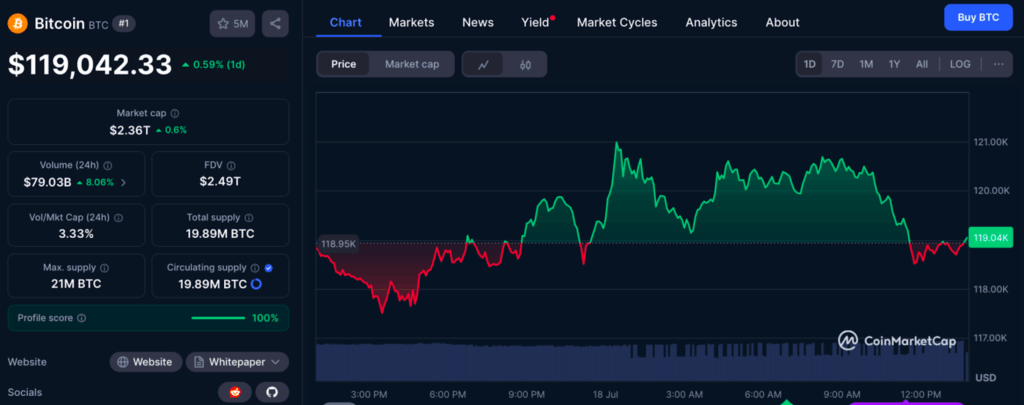
The volume of large transactions has risen above $133.55 Billion. This indicated the rising participation of big investors, probably multinational funds. Such transaction spikes are usually related to high price activity.
Also, often they involve custody transfer, exchange deposit, or treasury reallocation. The 24-hour volume-to-market cap ratio is .0333%. This further indicates the liquidity of the trading volume compared to the total valuation of the asset.
A ratio above 3% during a price surge often signals strong institutional activity. It may also suggest that major investors adjust their portfolios in response to market shifts.
Technical Indicators Support Bullish Outlook for Bitcoin Price
The technical point of view is supported because the high pace is reflected in network fundamentals. The overall value locked (TVL) of the various Bitcoin-related DeFi protocols has soared to $7.1 Billion. This indicated a +90.4% increase since the beginning of this month.
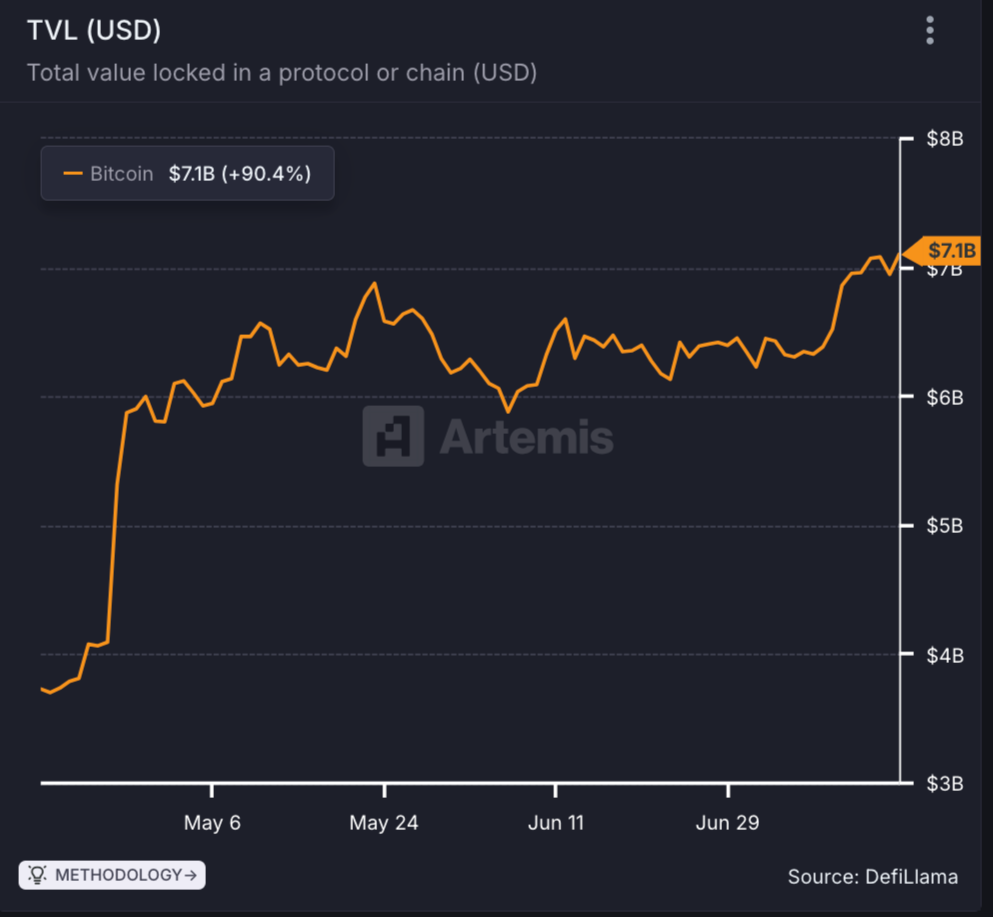
Large Bitcoin transfers are becoming more frequent, indicating rising activity among major holders. Simultaneously, more BTC is deployed in the Bitcoin ecosystem’s yield-generating strategies and liquidity pools.
The rising TVL shows the increasing adoption of developer- and BTC-backed DeFi protocols. This backs the bullish course of action. In line with this growth in large transfers, on-chain evidence of whale accumulation has been collected recently.
This displays similarities to the purchasing patterns in bull markets. The large wallets owned by whale investors, which have accumulated over 1,000 BTC, are in the repositioning consolidation phase.
High transaction volume doesn’t directly impact the Bitcoin price but signals stronger network engagement. This growing activity may set the stage for future shifts in Bitcoin price dynamics.
This is commonly a sign of an upcoming or confirmation of significant changes in trends. It is also related to the level of liquidity and confidence in the asset on which it is based: Bitcoin.
Short-Term Outlook: Momentum Remains Strong
$BTC is holding well above the current value of $119,000, and the transaction volume grew exponentially. The current pattern indicates the underlying demand to be high.
The retracement has seen the Bitcoin price go below support levels given by the moving averages of 50 and 100. Despite this, the Bitcoin price action remains above these levels.
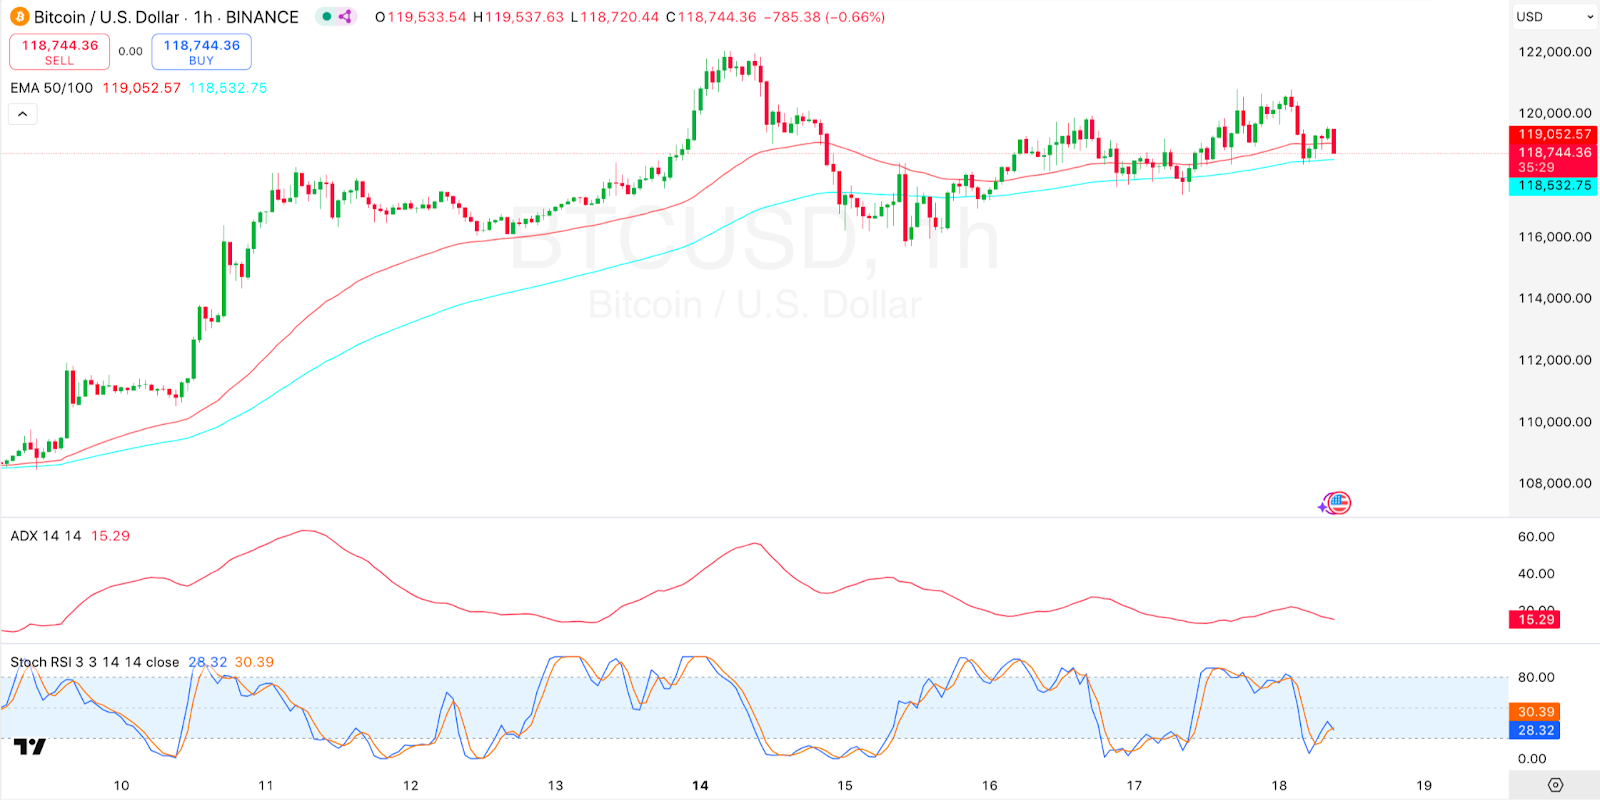
The slight dip to $118,744.36 is a consolidation period, which the upward breakout can follow. Moving above the recent high of 119,537 may mean another rise, and resistance might be within $120,000.
Stochastic RSI indicators indicate that a rebound could be imminent. It could happen due to oversold market conditions, causing buying pressure.
Disclaimer
This article is for informational purposes only and provides no financial, investment, or other advice. The author or any people mentioned in this article are not responsible for any financial loss that may occur from investing in or trading. Please do your research before making any financial decisions.





