
 streamoors
 Celestia
 IGNITION
 Injective
 Pudgy Penguins
 LayerZero
 Quantus

Key Insights:
- PEPE coin price was trading at a 77% discount compared to ETH, suggesting a lag in their historical correlation trend.
- ETH has reclaimed the 0.786 Fibonacci level while PEPE remains below its prior high, signaling divergence.
- Analysts forecast PEPE will reach new all-time highs, supported by rising market momentum.
PEPE coin price gained attention as analysts compared its value action against Ethereum‘s recent breakout. Notably, the token was trailing behind ETH in terms of recovery.
Consequently, this prompted discussions around whether it may soon catch up and retest its previous peak.
PEPE Coin Price Traded 77% Below Ethereum
In recent analysis, JACKIS, an analyst, observed PEPE coin trading at 77% relative to Ethereum. This value was estimated using high time frame (HTF) correlation analysis. It monitors long-term interdependencies of the meme coin price.
The analyst noted that such correlations would likely disappear in the short run. However, it tends to reconnect as time progresses. This led to concerns about whether the PEPE coin price can rise like ETH.
Additionally, the view was further reinforced by chart data. Ethereum’s price has already rallied sharply, surpassing its local resistance levels. At the same time, PEPE coin has yet to reach the mid-range.
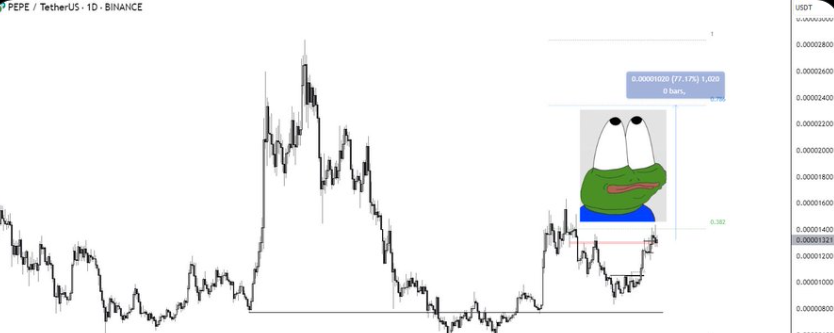
In the PEPE/USDT chart, the meme token was below the 0.382 Fibonacci retracement. On the other hand, in ETH/USDT, the top altcoin was rallying, trading above the 0.618 retracement.
Historically, both assets have shown periods of close correlation. This suggests the PEPE coin price may lag, which could resolve upward.
Ethereum Reclaimed 0.786 Fibonacci, PEPE Stalls
More so, Ethereum has recently broken the 0.786 fib level on its daily chart. This indicates a robust uptrend in its recovery trajectory. When writing, the top asset was above $3,500, having regained momentum after months of consolidation.
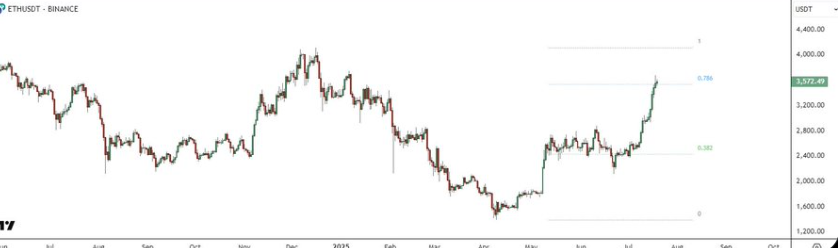
Ethereum’s move is a reference for correlated altcoins, especially those that previously mirrored its movements. In contrast, PEPE coin has yet to reach its previous high or even reclaim the 0.618 retracement zone.
The daily chart showed PEPE rebounding from a local support zone but trading below $0.000014. Furthermore, the disparity between Ethereum and PEPE may be short-term, although they were historically correlated.
The analysts implied that such a dip was a deferred upside option in case bullish market sentiment continues across the altcoins.
Analyst Predicts PEPE Coin Price May Reach All-time Highs
Another crypto analyst, Jake Gagain, recently tweeted that PEPE might post new all-time highs soon. The announcement was made as trading volume in PEPE recovered. It coincided with a surge in interest in the meme coin.
Jake Gagain’s remark contributed to the sentiment surrounding the PEPE coin price structure. This happened as investors’ indicators showed breakout momentum.
Moreover, the sentiment was reinforced by technical patterns. PEPE coin price chart showed a possible structure forming that could retest the $0.000020 zone. Such a move will bring PEPE near its previous record levels if momentum is sustained.
MACD and RSI Indicate Mild Uptrend Setup
PEPE coin’s MACD showed a modest bullish crossover on the technical indicators. The MACD line was trending above the signal line.
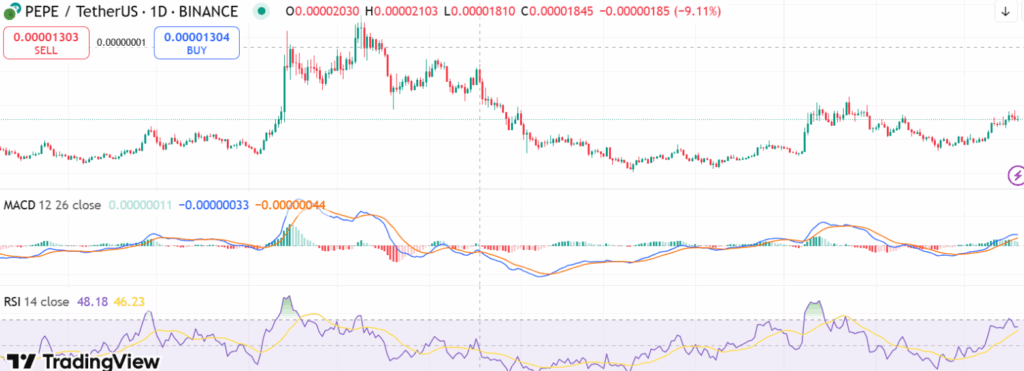
Consequently, this configuration suggested growing positive momentum. However, the histogram was small. This implied that buying strength was increasing, but not at full confirmation levels for a significant breakout.
Meanwhile, the RSI was at 61, dropping after its recent peak of 64. The reading indicated relative bullish momentum without crossing the overbought level.
The RSI was above the midline of 50, often considered a threshold between bullish and bearish sentiment. This suggests buyers were in control of the market.
Disclaimer
This article is for informational purposes only and provides no financial, investment, or other advice. The author or any people mentioned in this article are not responsible for any financial loss that may occur from investing in or trading. Please do your research before making any financial decisions.




