
 streamoors
 Altai the Tiger
 Sword Inu
 IGNITION
 no crying in the casino
 Quantus
 Pearl
Pearl

Key Insights:
- Solana price is developing an ascending triangle, indicating that it could surge above the $220 mark.
- Fibonacci levels indicate that Solana could rise to around $360 should the bullish momentum continue.
- Analyst advises holding Solana, as technicals point to major gains after consolidation.
Solana’s price market structure and distribution call out a sustained continuation in its positive moves and major breakout. Market analysts claim this is not the right time to cut back positions, because the technical indicators still point to further gains.
One of the most talked-about targets is $360, which can be estimated based on Fibonacci extension levels and is a possible destination of the second strike of SOL..
Triangle Pattern Signals Solana Price Breakout
Solana price action has been consolidating into an ascending triangle pattern, a formation characterized by an increase in the lows and a refusal of the price to rise above a formation level. This pattern is a bullish continuation pattern with a breakout towards the higher side.
The zone of resistance around $220 is a major spot to watch for Solana, as its breaching may trigger additional upwards dynamics.
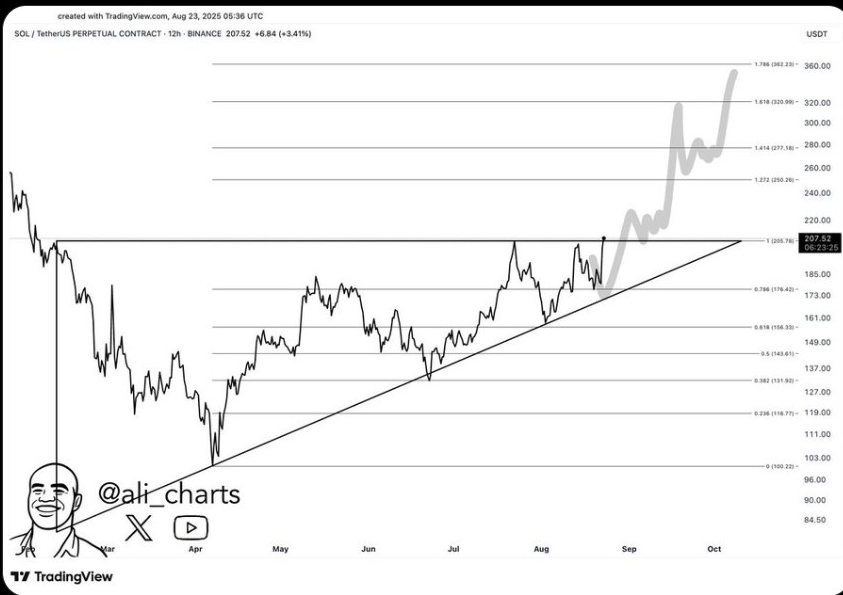
The ascending triangle is formed when buyers accumulate as they keep on taking up the selling pressure once the price touches support. As analysts observe, such formations strengthen with time when sellers become weak and demand accumulates.
A decisive break above $220 would confirm the breakout’s strength and increase the chances of follow-through into higher price targets.
Technical Levels and Fibonacci Targets
Technical analysis shows that upon breaking above the $220 resistance, Solana can test the next upside targets around $240 and $280 levels, which coincide with Fib extensions.
Every bullish surge is bound to strengthen the market’s belief, particularly since Solana tends to show sudden gains after it surpassed key obstructions in the past.
Beyond these intermediate levels, analysts placed attention on the $360 mark. This target is derived from the 1.618 Fibonacci extension. The calculation suggests that the altcoin can extend well beyond its short-term resistance zones.
Channel Structure and Support Levels
In addition to the ascending triangle, Solana price is also experiencing an upward trend in a rising channel, which is also a supporting indication of a rally. This channel has been the pathway that the asset has followed in recent weeks as price action adhered to their upper and lower ends.
A round-bottomed formation in this channel supported the bullish structure which is considered to be a strong basis of continued bull power.
Technically speaking, the first resistance is at $215 and will give an early indication of buyer demand strength. A confirmed breakout above the $227 should be viewed as an indication. That the bulls have control and the rally will continue toward the upper end of the channel around $251.
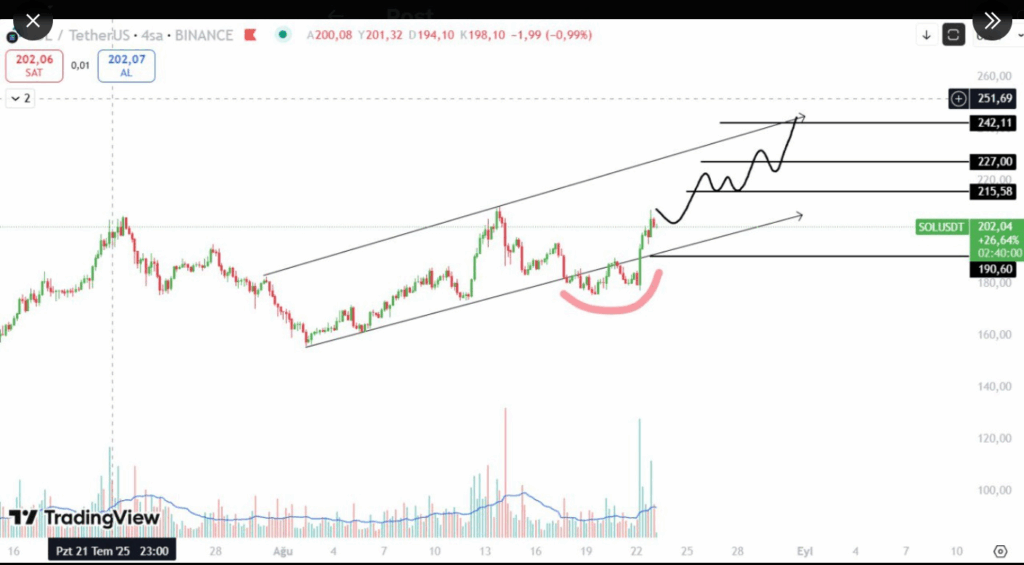
On the flipside, the support area of $190 is the new pivotal area. Support at these levels will keep the uptrend alive but a failure would jeopardise the present bullish outlook.
Considering the pattern of an ascending triangle, the rising channel pattern. And Fibonacci levels, analysts continue to argue that the altcoin’s bullish structure still holds. They believe holding until the $360 target provided the best opportunity to capture the altcoin upside.
Moreover, most recently, other analysts also predicted that Solana could climb toward $300 in August 2025. Analysts argue that ETF inflows and strong institutional demand will continue to drive momentum. Combined with Solana’s network throughput milestones and sustained support above $180, bullish conditions remain intact.
The altcoin price stood its ground above the $200 mark amid the recent breakout. Solana has a current market capitalization of 109.02 billion dollars. Wh a 37% increase in trading volume within 24 hours at press time.
Disclaimer
This article is for informational purposes only and provides no financial, investment, or other advice. The author or any people mentioned in this article are not responsible for any financial loss. That may occur from investing in or trading. Please do your research before making any financial decisions.



