
 Zerebro
 Bitcoin
 Pudgy Penguins
 NEAR Protocol
 Quantus
 Pearl
Pearl ZKsync

Solana price shows strong bullish momentum after breaking out of a key ascending triangle pattern. The breakout above $205 has boosted investor confidence.
With this, analysts are looking for higher Fibonacci targets. Meanwhile, traders are now paying attention to key support zones to gauge the next phase of the rally.
Breakout Signals Solana Price Path to $360
Market analyst Ali Martinez highlighted the breakout of SOL price from an ascending triangle. This signals a potential mid-term target of $360. The breakout exceeded the $205 resistance level, confirming a bullish continuation pattern.
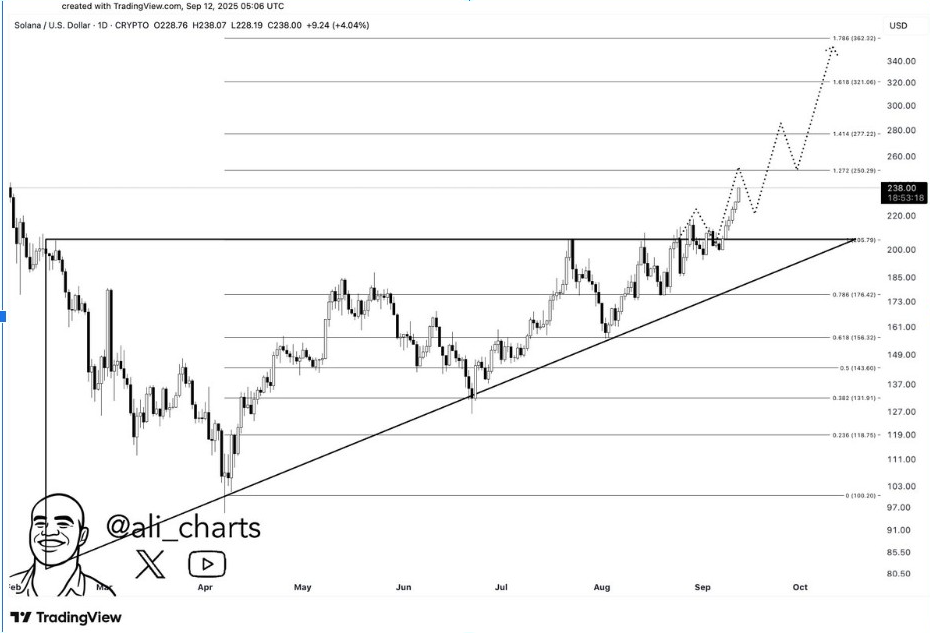
His chart showed Fibonacci extensions pointing to successive targets at $250, $277, $321, and finally $362.32. These are critical price zones where traders could book profits or add to positions.
Ali said holding above the $205 breakout level is essential to sustain momentum. If Solana price stays above this support, the path toward $360 remains valid. This bullish pattern indicates heavy demand on the market during short-term corrections.
Momentum Builds Toward $250 Target for Solana Price
Furthermore, analyst Broke Doomer maintained firm optimism. The analyst projects a target of $250 for the SOL price in the short term. He highlighted Solana’s strong resistance test and “giga bullish vibes,” expecting a big breakout in the fourth quarter.
Notably, he argued that patient investors might benefit from the transfer of value from the impatient sellers. Broke Doomer reckoned that becoming a millionaire by 2030 would be possible if 4,115 SOL were accumulated.
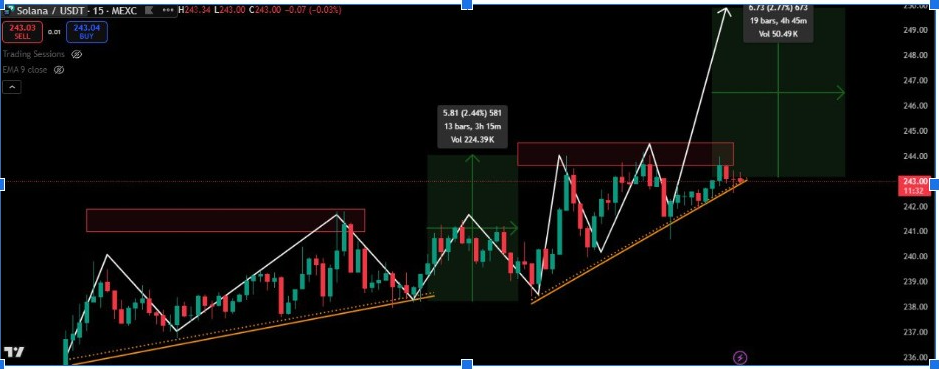
His short-term chart showed a series of higher lows supporting the uptrend. He stated that Solana’s price could accelerate further once the $250 is cleared there.
Crucially, Broke Doomer’s projection builds on Solana’s growing institutional adoption. He emphasized that short-term pullbacks should not discourage long-term positioning as long as key supports are firm.
Fibonacci Gains Point To $255 Resistance
Meanwhile, CryptOpus gave a trade recap from a 38% rally from the Fibonacci buy zone around $176 to $243. The trade started after a clean retest at $211.6, with the first two targets reached at $213.24 and $232.09.
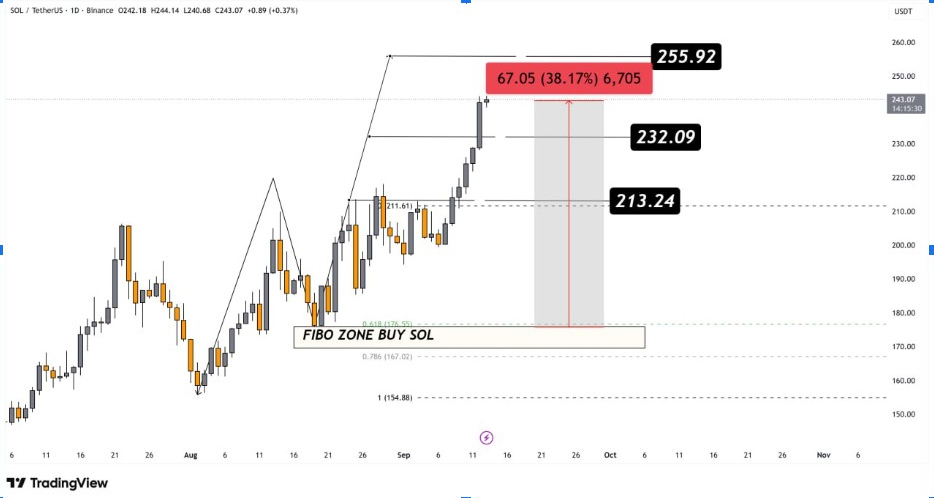
He anticipates the SOL price reaching $255.92 as the next technical objective. The setup features disciplined entry and exit levels based on Fibonacci retracement and extension principles.
CryptOpus attributed the bullish upward movement to consistent demand and good market structure. He emphasized that if it holds above $232, the trend remains intact for a push towards higher resistance zones.
Bearish Patterns Point Towards Possible Decline
However, Whale Guru cautioned that the recent rally of the Solana price might be nearing exhaustion. He characterized the move as an “exit pump.” There will be a sharp decline shortly.
His chart compared the existing patterns to past big selloffs. Red ellipses indicate past peaks that yielded to steep declines. This suggests history may repeat. Critical levels are near the $280 and $296 zones, which he flags to watch for weakness.
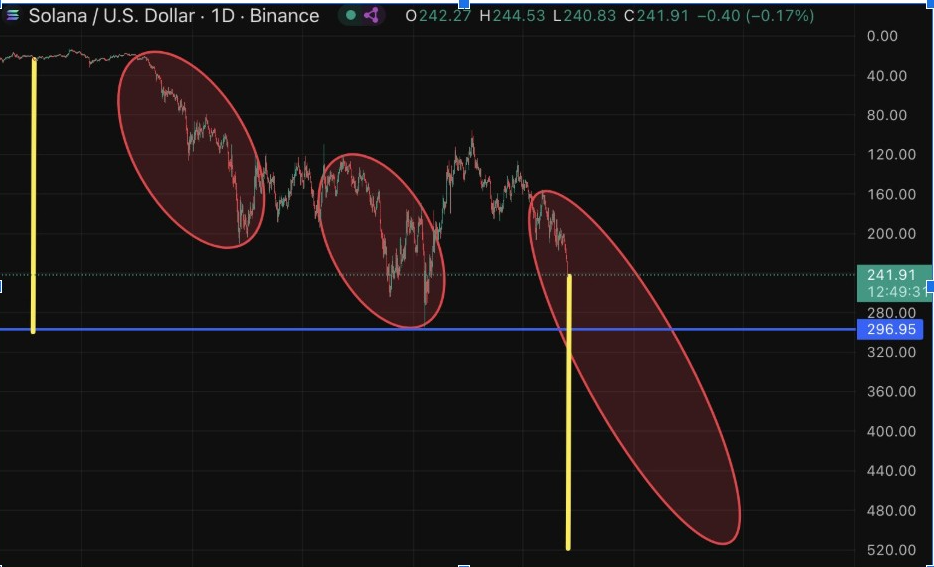
Whale Guru’s bearish preview reminded investors to expect volatility. He believed that if sellers regain control, the SOL price could face a rapid downside similar to earlier cycles.
However, current trading near $239 hasn’t confirmed a breakdown. Traders will watch the price reaction, around $205 and $232, to see if selling pressure builds.



