astronaut
 Zylo Ecosystem
 Pearl
Pearl Bitcoin
 Quantus
 Pudgy Penguins
 Bitway

The IBIT ETF stock price has done well this year. This happened thanks to the performance of Bitcoin, as demand for cryptocurrency exchange-traded funds soared. This article explores what to expect as the BlackRock Bitcoin ETF nears $100 billion in assets.
IBIT ETF Leads Bitcoin ETFs Surge as Wall Street Embraces Digital Gold
The demand for Bitcoin ETFs on Wall Street is soaring this year. SoSoValue data4 shows that the spot Bitcoin ETFs have had over $57B inflows since their inception in January last year.
These funds now hold over $152 Billion in assets. This represents about 6.62% of the circulating Bitcoin market capitalization. BlackRock’s IBIT ETF is leading the charge, possibly because of its stronger brand than other companies.
The fund has attracted over $60 Billion since its inception. On the other hand, its assets under management have jumped to over $88.5 Billion. The fund will cross the $100 billion milestone if this trend continues.
This would happen either in the fourth or first quarter of next year. Considering the SPDR Gold ETF (GLD), this will be a major milestone. It was launched in 2004 and has over $115 Billion in assets. As such, there are odds that the IBIT will flip it in the coming months.
The other notable aspect is that IBIT has become the most profitable and the eighth biggest BlackRock ETF by assets. It has a 0.25% expense ratio, significantly higher than IVV’s 0.03%. This allows it to generate more income despite IVV’s massive $625 Billion in assets.
Bitcoin ETFs have attracted significant assets recently. Many investors now see Bitcoin as a mature alternative investment. It’s also viewed as uncorrelated with traditional assets like stocks and bonds.
Further, investors are likely excited about its historical returns. It moved from less than $1 in 2009 to over $117,000 today.
IBIT ETF Stock Price Has Major TaFed ‘sinds Ahead
The IBIT ETF stock price will continue doing well in the long term because of its substantial tailwinds. First, the Federal Reserve has started cutting interest rates, and officials hinted at two more this year.
Analysts expect the bank to deliver more cuts in 2026 when Donald Trump replaces Jerome Powell with a more friendly chairman. Indeed, one standout part of the interest rate decision was that Stephen Miran voted to cut interest rates by 0.50%. He became a Fed governor this week.
Bitcoin and other risky assets usually do well. This happens when the Federal Reserve is cutting interest rates, which incentivizes risk-taking among investors.
Another key driver for the IBIT ETF is a sharp drop in Bitcoin supply. This supply crunch is happening just as demand surges. Bitcoin supply in exchanges has dropped to the lowest level in years.
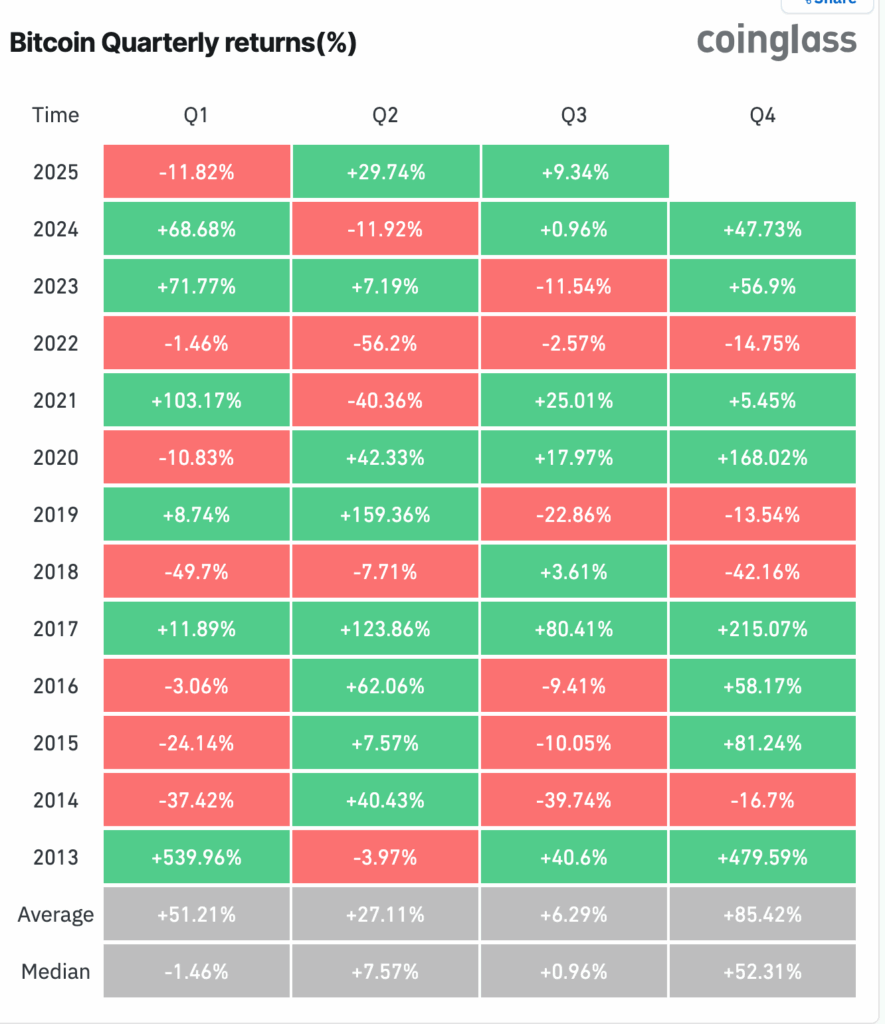
Further, as the chart below shows, the fourth quarter is Bitcoin’s best-performing period of the year. The average return since 2013 was over 85%. It has jumped in eight Q4s, which may continue this year.
Bullish Flag Pattern Points to IBIT Stock Price Surge
The daily timeframe chart shows that the IBIT ETF stock has strong technicals. This may drive it higher soon.
The fund has formed a bullish flag pattern. Thisconsisting of a vertical line and a descending channel currently being formed. This pattern means the fund will likely have a strong bullish breakout in the fourth quarter.
The IBIT stock price has remained above the 50-day and 100-day Exponential Moving Averages. It has also moved to the strong pivot reverse point of the Murrey Math Lines.
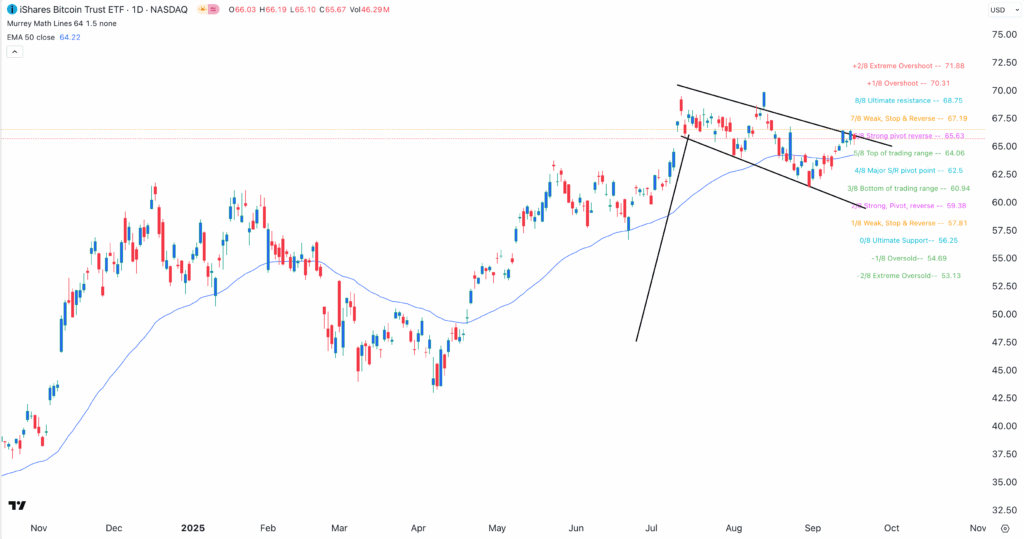
The stock will therefore surge as bulls target the extreme overshoot level at $71. It is about 9% above the current level.
The bullish forecast will become invalid if the coin plunges below the lower side of the flag at $60. This coincides with the strong pivot, reverse of the Murrey Math Lines.