
 astronaut
 Pearl
Pearl Zcash
Zcash Walrus
 NEAR Protocol
 Starknet
 Pudgy Penguins

Bitcoin price hovered above the $85,000 support zone on Dec. 18 as traders tracked clustered liquidity levels. Bitcoin traded near $87,000 on Bitstamp while leverage positioning tightened around key intraday ranges. Analysts flagged rising liquidation risk as market makers targeted nearby liquidity pockets.
The setup mattered because Bitcoin price entered a compression phase driven by leverage, not conviction. Short-term positioning, oversold momentum signals, and fading macro catalysts shifted focus toward mechanical price moves. The next break likely depended on which side of liquidity cleared first.
Bitcoin Price Held $85,000 as Leverage Clusters Shaped Direction
Bitcoin price defended the $84,000–$85,000 zone after last week’s selloff stalled. Ted Pillows said the level remained critical for short-term structure. He warned that a break below it likely triggered a retest of November lows.
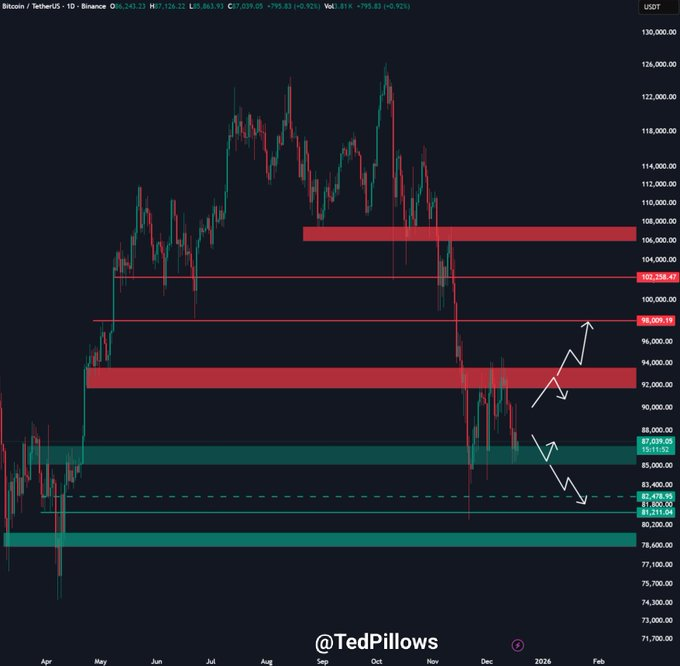
Price rebounded sharply from near $80,000 earlier this month. Buyers absorbed sell pressure quickly, forcing a move back into the mid-$80,000s. That bounce, however, failed to restore higher highs.
Lower highs capped recovery attempts, keeping Bitcoin price trapped inside a descending structure. Volatility compressed as both sides reduced directional exposure. The market shifted from trend trading toward liquidity hunting.
Liquidity Clusters at $87,500 and $90,200 Came into Focus
Ted Pillows said Bitcoin price currently sat between two short-term liquidity clusters. He identified two clusters, one near $87,500 and another around $90,200. According to him, both zones contained heavily leveraged positions, ranging from 50x to 100x.
He said market makers typically targeted such clusters once price stalled. That behavior often produced sharp, fast moves designed to force liquidations. In this setup, direction mattered less than proximity to leverage.
The $87,500 zone aligned closely with current spot prices. A sweep lower could clear long leverage before any sustained recovery. Conversely, a push higher toward $90,200 risked triggering short liquidations.
$90,000–$92,000 Remained the First Upside Barrier
Ted Pillows said Bitcoin price could attempt a rally toward $90,000–$92,000 if $85,000 held. That zone marked a former breakdown area during November’s decline. Sellers previously defended it aggressively.
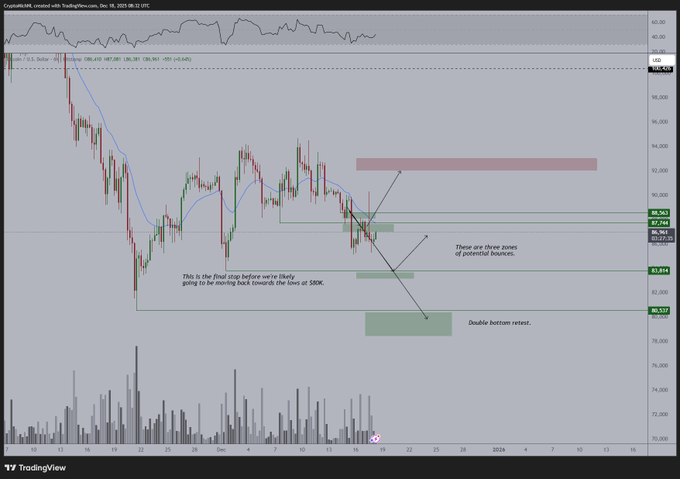
A reclaim of $88,000 acted as the first confirmation signal. Michaël van de Poppe said a break above $88,000 would restore constructive structure. He added that sentiment stayed cautious, with many traders sidelined.
Van de Poppe said expectations around macro events looked crowded. He argued markets often moved against consensus positioning. That dynamic reduced confidence in a clean, event-driven breakout.
Oversold RSI History Suggested Basing, not Immediate Trend Reversal
Julien Bittel, CFA, shared data tracking Bitcoin’s average path after oversold relative strength index readings. He said that Bitcoin historically follows a gradual recovery once the RSI drops below 30. According to Bittel, current price action continued to track that historical average closely.
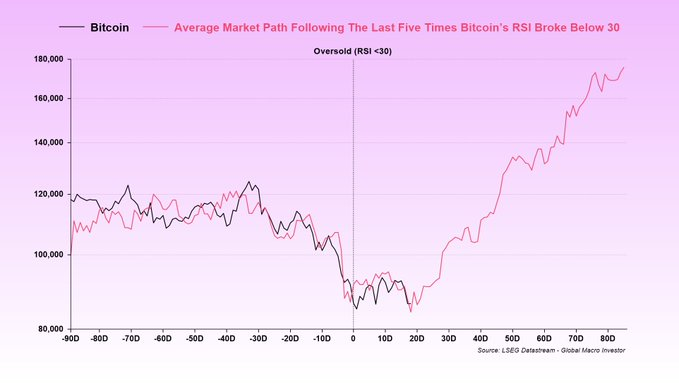
He cautioned that bases rarely formed cleanly. Bittel said consolidation phases often featured sharp swings and failed breakouts. His analysis pushed back against expectations for a straight-line recovery.
Bittel stressed that his framework assumed the bull market remained intact. He said traders expecting prolonged downside should disregard that model entirely. The chart, he said, only applied if the cycle continued.
The Four-Year Cycle Thesis Weakened as Liquidity Dominated
Bittel said the four-year cycle framework no longer explained Bitcoin price behavior. He argued that prior cycles never revolved around halving events, despite popular belief. Instead, public debt refinancing cycles drove liquidity expansions.
He said changes in weighted average debt maturity altered those cycles. Longer debt durations extended liquidity windows. As a result, Bitcoin price cycles stretched rather than compressed.
Bittel added that interest expense monetization now exceeded gross domestic product growth. That imbalance, he said, supported prolonged liquidity-driven asset cycles. Under that view, Bitcoin’s consolidation did not signal exhaustion.
Macro Event Risk Faded as Traders Waited for Direction
Michaël van de Poppe said traders remained patient ahead of the Bank of Japan decision. He noted that previous Bank of Japan events triggered large market reactions. This time, he said expectations appeared overly one-sided.
He argued that heavily anticipated outcomes often fail to meet market expectations. According to him, Bitcoin price already reflected much of that risk. That assessment reduced the likelihood of a macro-driven breakdown without new information.
As macro pressure eased, technical and positioning factors regained influence. Bitcoin price began reacting more directly to leverage and support zones. The $85,000 level became the anchor.
Altcoin Structure Reinforced the Need for Bitcoin Stability
George Tung of CryptosRus said the altcoin market structure resembled past cycle setups. He referenced total crypto market capitalization excluding Bitcoin and Ethereum. According to Tung, multi-year support held as liquidity tightened near the lows.
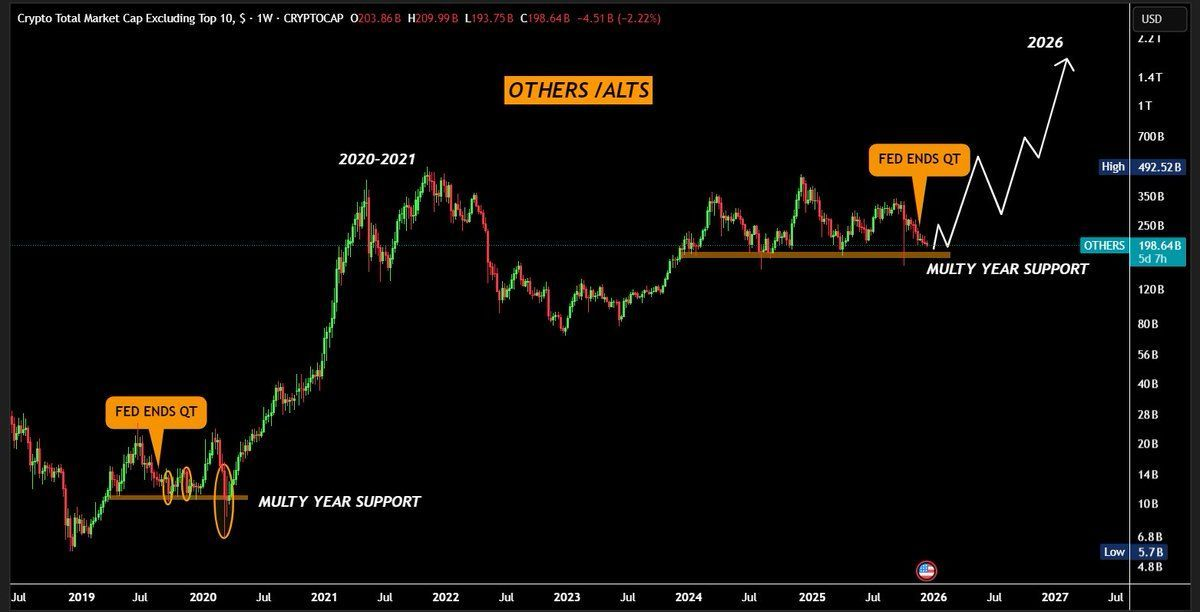
He said that previous breakouts had followed the end of Federal Reserve quantitative tightening. Tung noted that exchange-traded funds now operated alongside expanding on-chain finance. He said those factors matched earlier expansion phases.
Historically, Bitcoin price stabilized before capital rotated into altcoins. That pattern placed additional importance on Bitcoin holding key support. A breakdown risked delaying any broader rotation.
Levels that Defined the Next Move
Bitcoin price traded between $85,000 support and $88,000 resistance. A daily close below $84,000 likely reopened downside toward $80,000. Above $88,000, liquidity near $90,200 became the immediate target.
Short-term direction depended less on narratives and more on leverage cleanup. With clusters nearby, the risk of volatility remained elevated. The next decisive move likely came from forced positioning, not patience.




