Wisp
Wisp Crawlerpad
 Pearl
Pearl Zylo Ecosystem
 Quantus
 Sonic
Sonic Pudgy Penguins

Bitcoin price entered a historically rare undervaluation zone as on-chain metrics diverged from recent market weakness. Data showed network activity holding firm while price retraced sharply from six-figure levels. Analysts warned that short-term structure remained fragile despite long-term valuation signals improving.
This setup mattered because Bitcoin price now sat at a crossroads between structural accumulation and technical breakdown. The NVT Golden Cross, often compared to a price-to-earnings ratio, suggested Bitcoin traded below its usage-based value. However, traders continued to focus on near-term liquidity risks and declining support levels.
NVT Golden Cross Signaled Discounted Bitcoin Price
On-chain data shared by CryptosRus showed Bitcoin’s NVT Golden Cross falling into a zone historically linked to valuation resets. The metric compared market capitalization with actual network usage. CryptosRus noted that prior entries into this zone occurred after price fell faster than on-chain activity.
The analyst stated that these periods typically followed forced selling and unwinding of leverage. Long-term holders absorbed supply during those phases, according to historical data. The network itself did not show signs of stress or declining usage.
CryptosRus added that Bitcoin price often stabilized before broader recoveries during previous NVT compression phases. However, he emphasized that valuation alone did not determine the short-term direction. Price recovery still required confirmation through structure and liquidity behavior.
Bitcoin Price Structure Remained Weak Below $100,000
Despite improving valuation signals, Bitcoin price struggled to reclaim key resistance zones. CyrilXBT said Bitcoin lost the $100,000 level, which now acted as overhead resistance. At the time of writing, price hovered near $85,000.
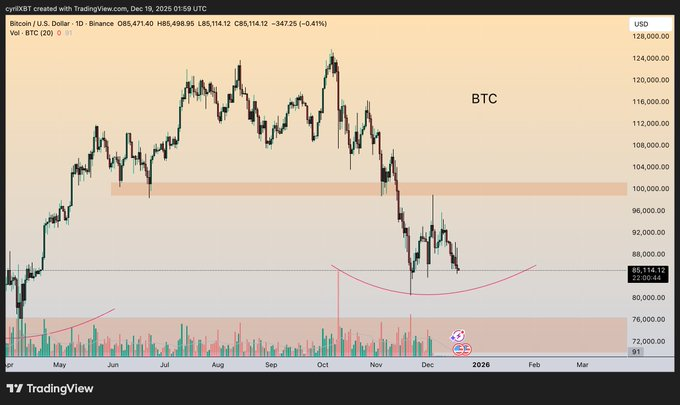
CyrilXBT warned that $85,000 served as the most important short-term support. A break below that level exposed a potential move toward the $76,000 demand zone. He added that bulls needed to reclaim $88,000–$92,000 first to regain momentum.
The analyst framed the current move as corrective rather than trend-confirming. He said price action reflected exhaustion following rapid upside moves earlier in the cycle. Until Bitcoin price reclaimed $100,000, downside risks remained elevated.
USDT Dominance Echoed 2021 Distribution Phase
KillaXBT shifted focus toward stablecoin dominance as a broader market signal. He said the USDT dominance chart closely resembled conditions seen in 2021. During that period, Bitcoin ranged for months before resuming its trend.
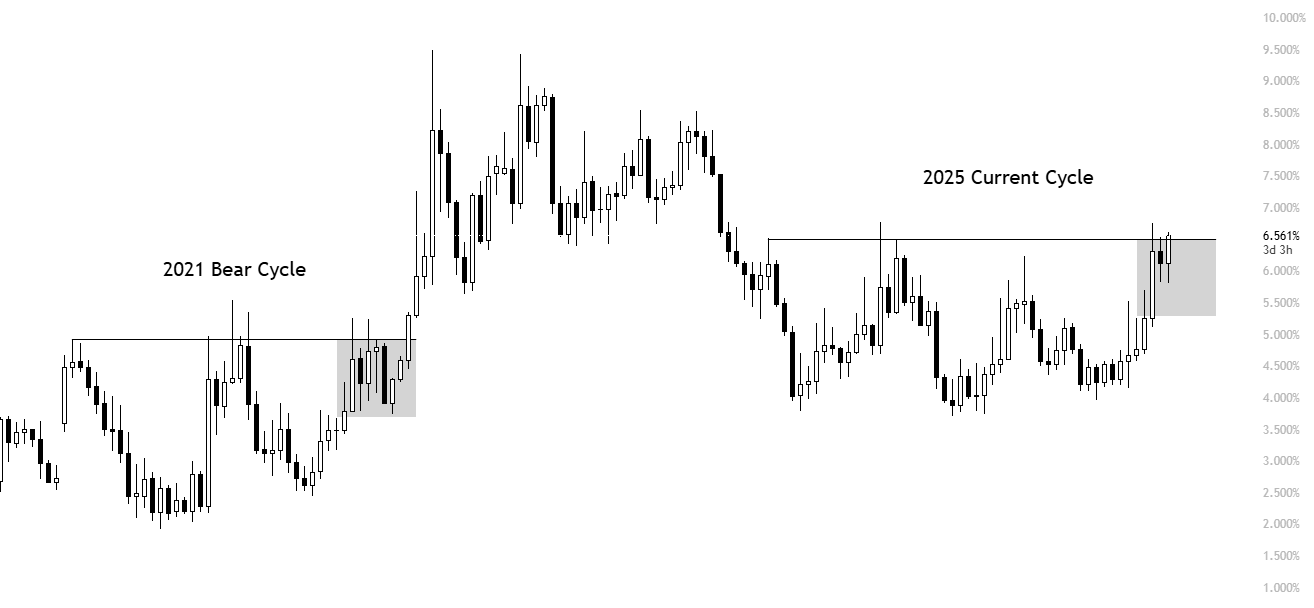
KillaXBT noted that when USDT dominance first tested resistance in 2021, Bitcoin fell from $45,000 to $24,000. That decline occurred during extended consolidation rather than a straight selloff. He said bear markets often lasted around 300 days, while the current phase measured closer to 70 days.
The analyst added that as long as USDT dominance remained below resistance, Bitcoin price could still bounce. However, a breakout in USDT dominance likely sent Bitcoin toward $74,000 or $68,000. He described those zones as likely downside targets if liquidity conditions worsened.
New Whale Capital Altered Traditional Bitcoin Cycles
Separate on-chain analysis showed that new whales now controlled nearly 50 percent of Bitcoin’s realized capitalization. The data did not imply ownership of half the supply. Instead, it showed half of invested capital entered at relatively recent price levels.
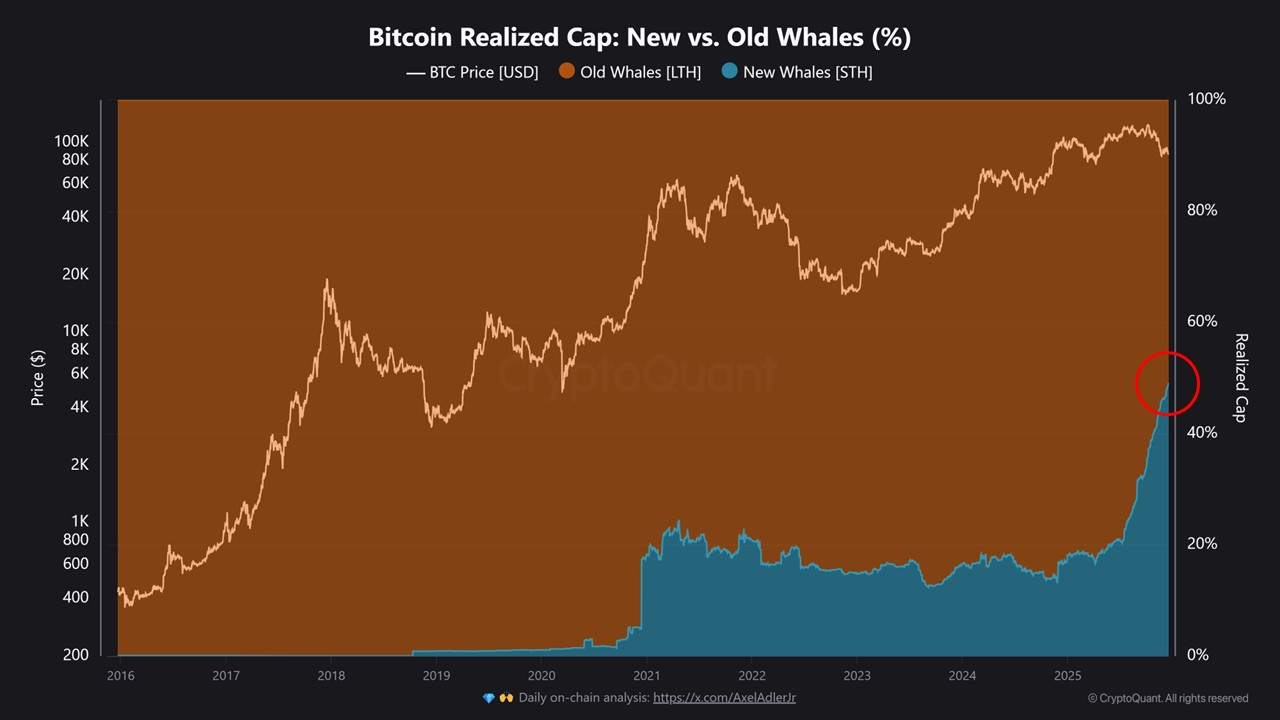
The report said these new whales differed from early-cycle accumulators. Earlier holders accumulated at low prices and distributed during rallies. New whales entered at higher prices while deploying much larger capital pools.
According to the analysis, these whales largely consisted of corporations and exchange-traded fund allocators. Their behavior reflected structural allocation rather than short-term trading. As a result, realized capitalization continued rising even during price corrections.
The report warned that this shift challenged traditional Bitcoin cycle theories. Historical models assumed speculative flows dominated market structure. Persistent institutional accumulation suggested a different cost-base dynamic for Bitcoin price.
What Traders Watched Next for Bitcoin Price
Taken together, the data painted a divided picture for Bitcoin price. On-chain valuation metrics pointed toward accumulation conditions rather than distribution. At the same time, technical structure remained fragile below key resistance levels.
Analysts focused on $85,000 as the immediate support level. A clean break below that level risked accelerating losses toward the mid-$70,000 region. Conversely, reclaiming $92,000 would ease bearish pressure and reopen a path toward $100,000.
USDT dominance also remained critical. Acceptance above resistance shifted probabilities toward deeper downside. Failure to break higher allowed room for consolidation-driven bounces.
Bitcoin price now reflected a market transitioning rather than collapsing. Structural capital flows reduced the relevance of older cycle models. However, short-term direction still depended on liquidity, leverage, and reclaiming broken levels.