
 astronaut
 Walrus
 Pearl
Pearl Bitcoin
 NEAR Protocol
 Zcash
Zcash Hyperliquid

Bitcoin price retreated to $87,000. It was down by over 10% from its highest level this year and 30% below its all-time high. This retreat could continue as Bitcoin has formed a bearish flag pattern as geopolitical risks rise.
Crude Oil Price Has Soared as Trump’s Armada Arrives in the Middle East
The geopolitical situation in the Middle East shows signs of accelerating. Donald Trump issued a warning to the Iranian regime. His remarks raised concerns about a potential attack and heightened regional risks.
In a statement, he warned the regime to negotiate on measures to end its nuclear weapons program or risk a major attack.
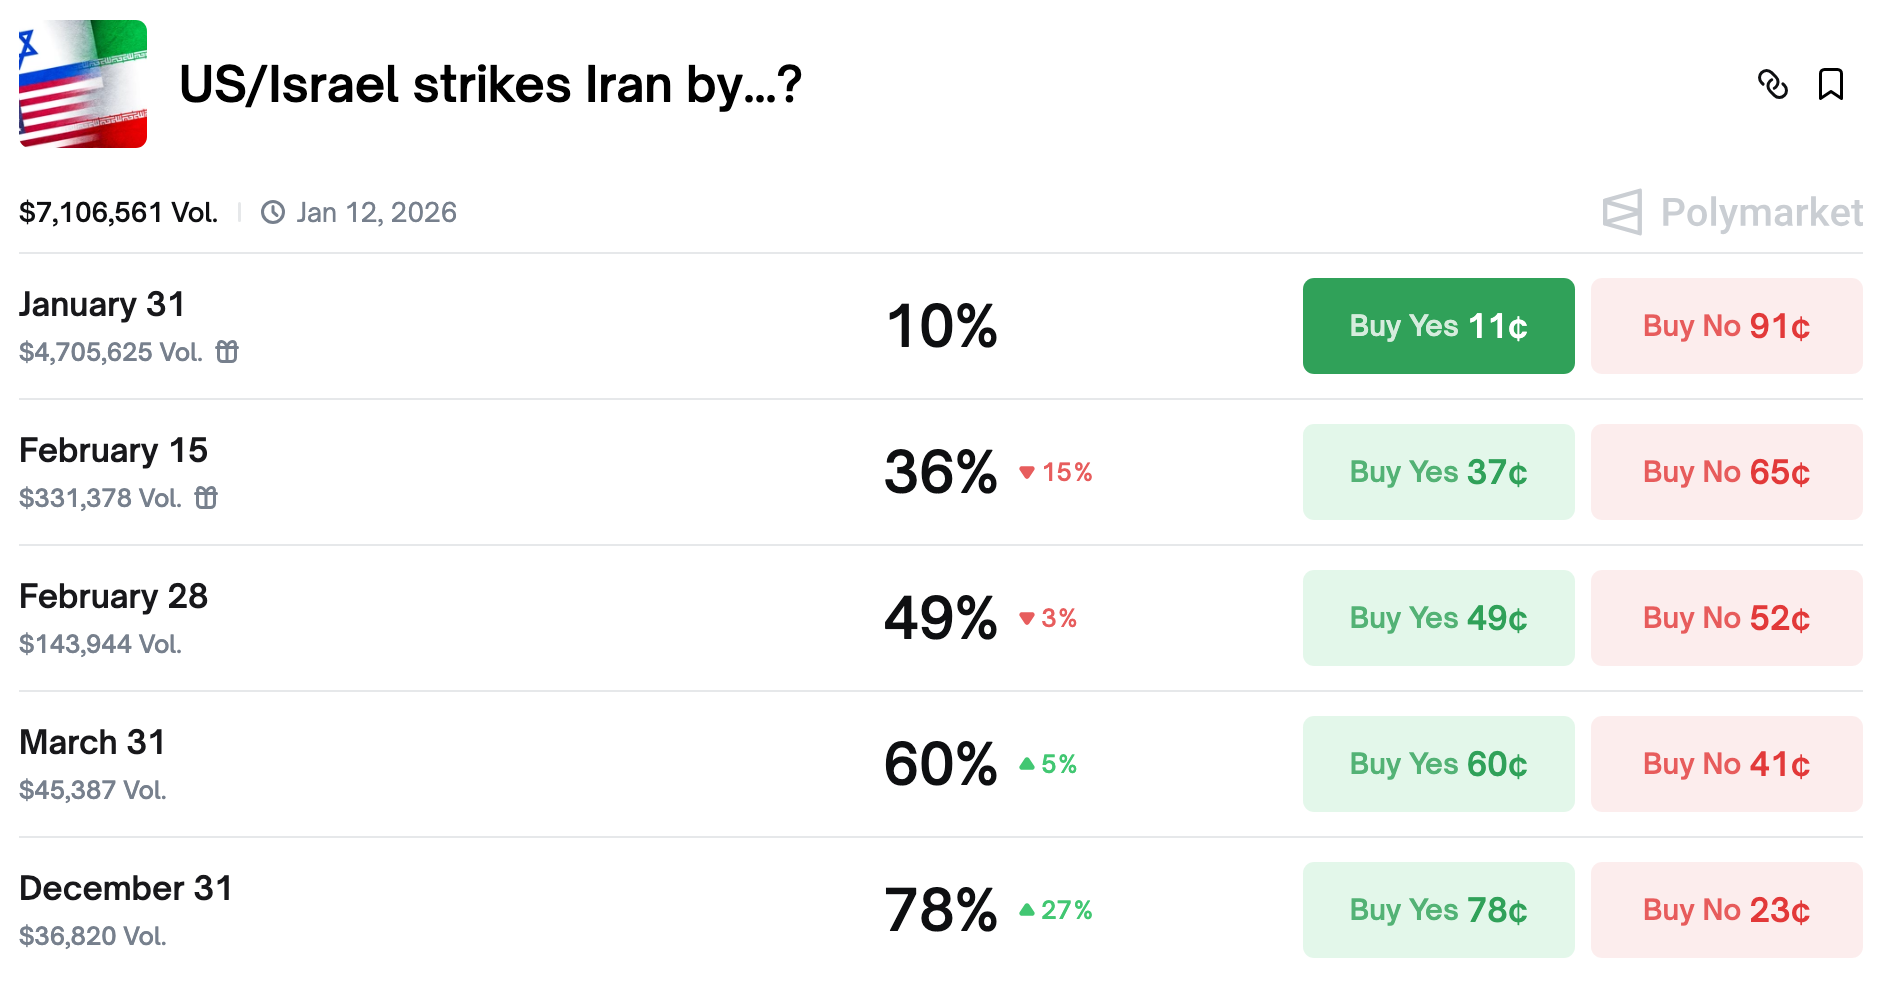
There are signs that an attack aimed at regime change will happen in Iran soon. A Polymarket poll shows that the odds of an attack by March 31st and December 31st rose to 60% and 70%, respectively.
Iran has responded to the threats by expressing hopes of negotiations. At the same time, its leaders warned of serious consequences. They threatened attacks on US military officials in the Middle East and Iran. They also cautioned about possible disruptions in the Strait of Hormuz.
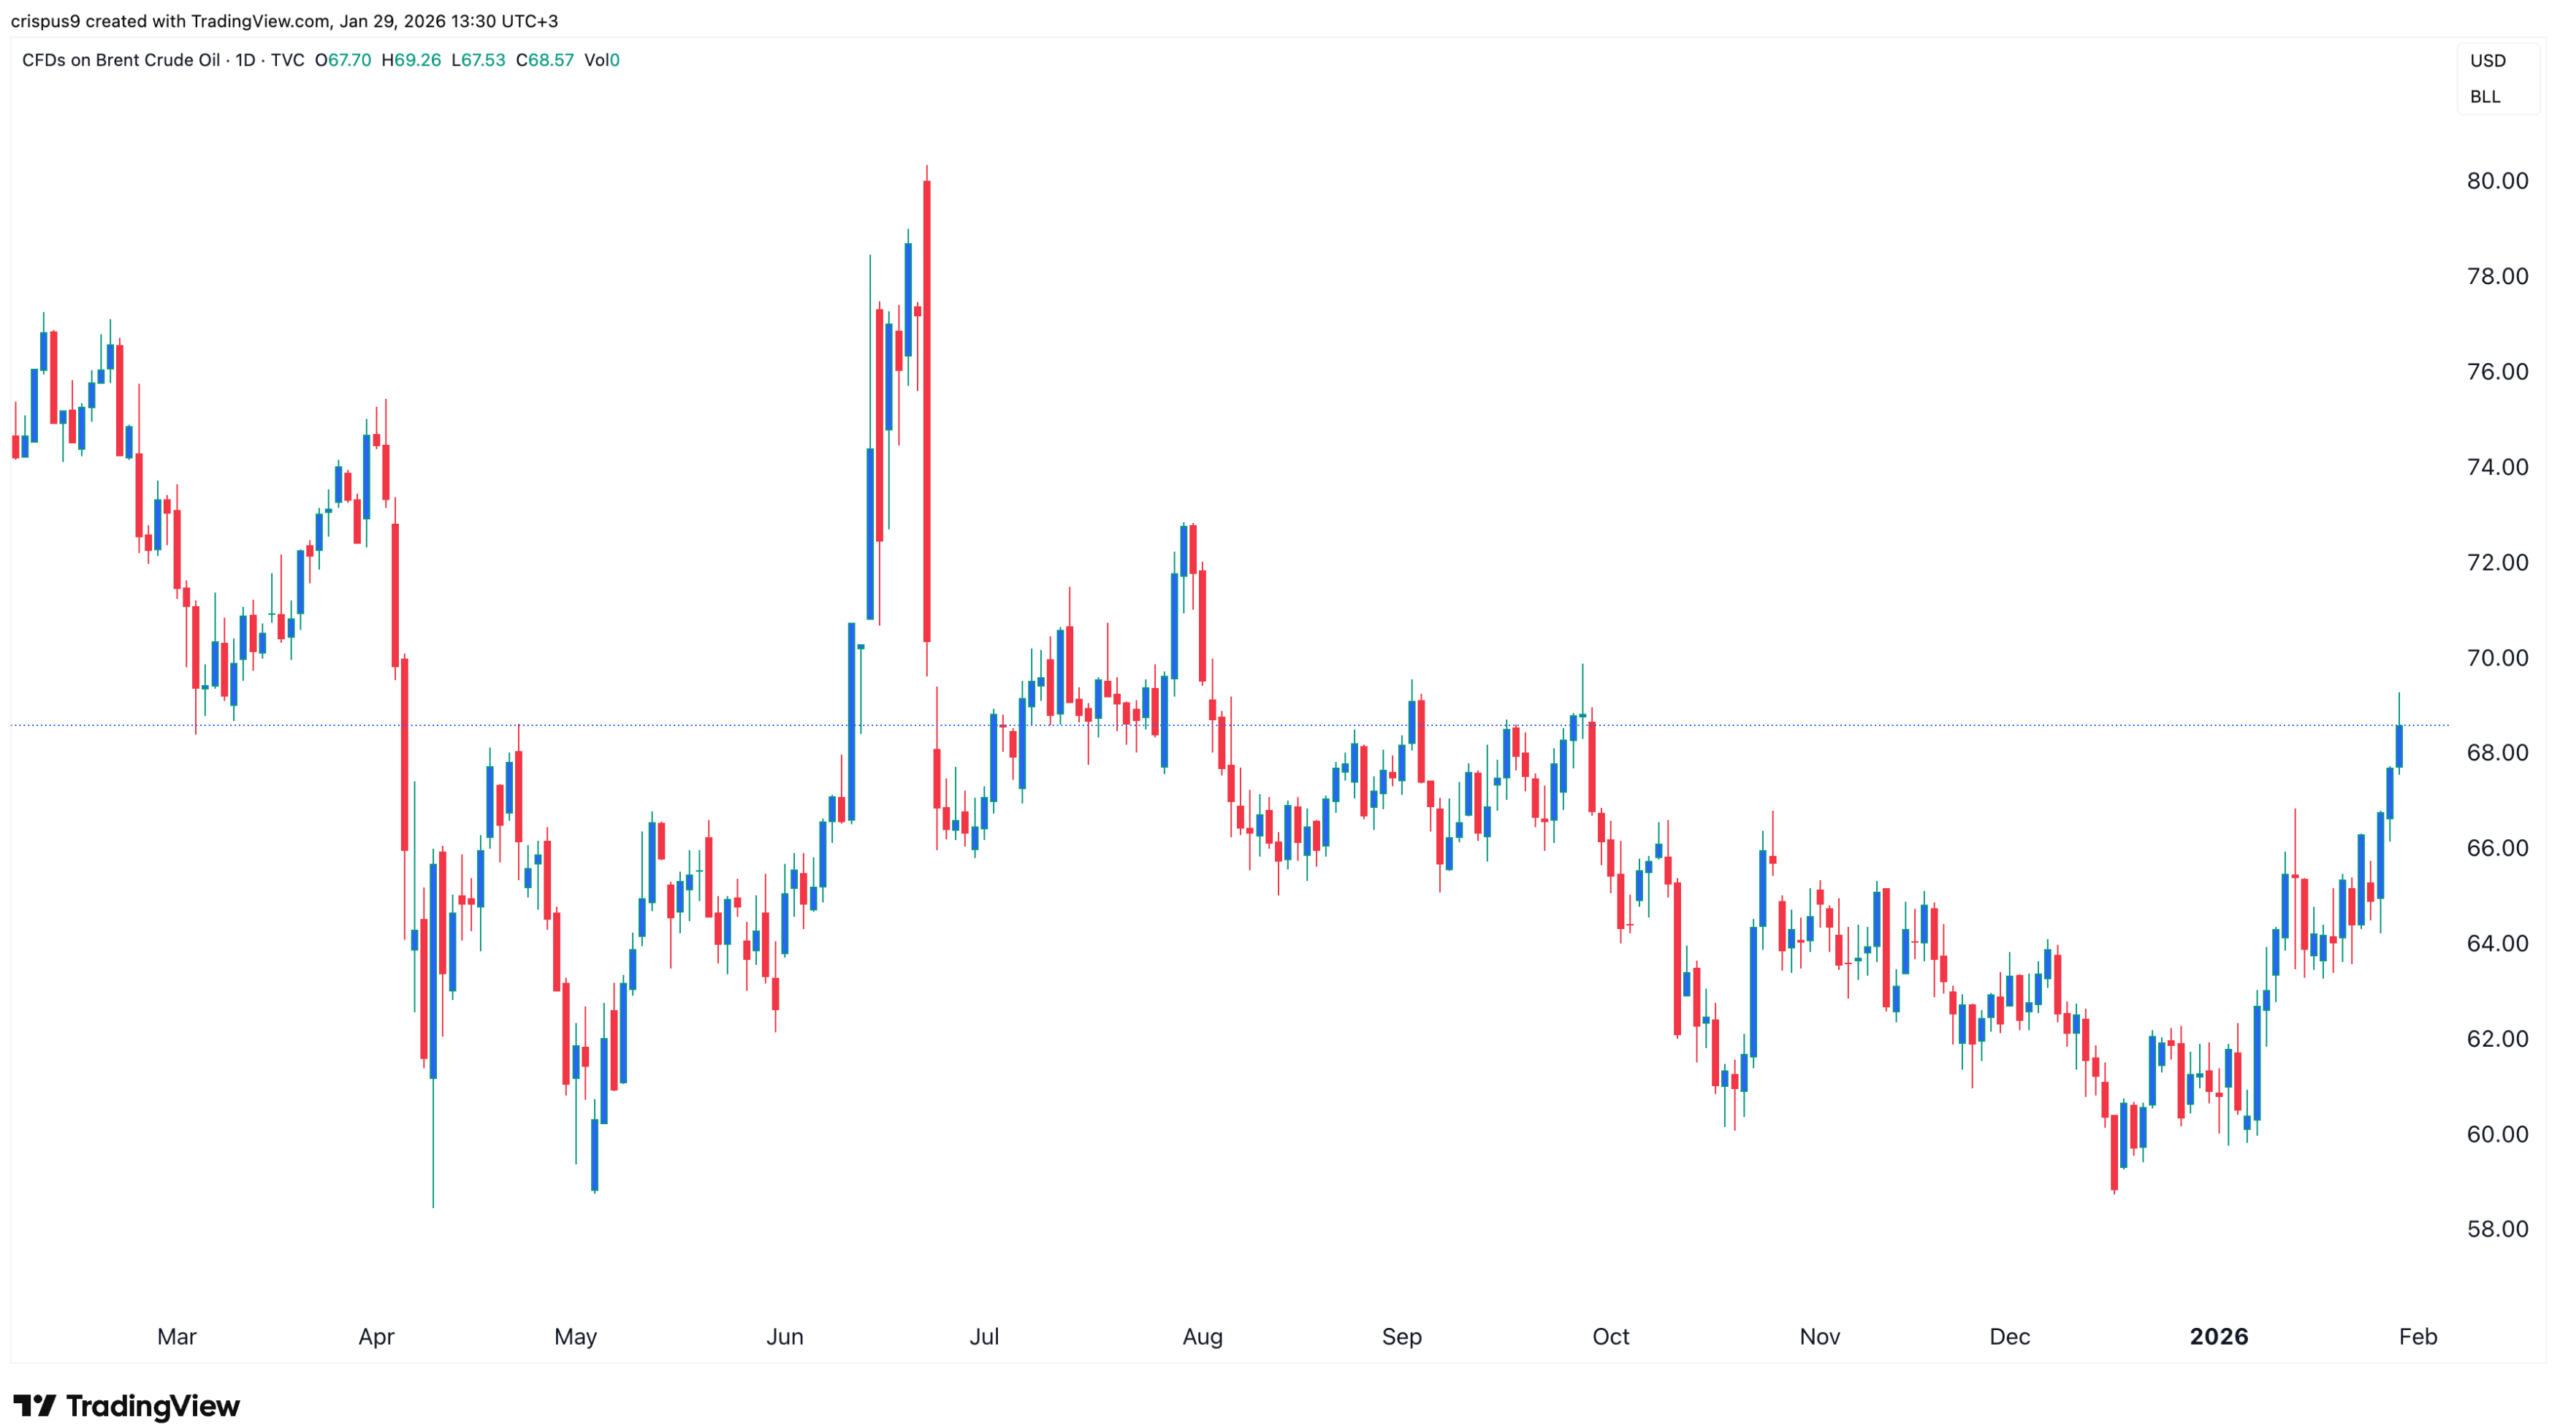
These warnings explain why the price of crude oil has jumped this week. As the chart below shows, the price of Brent, the global benchmark, has jumped to $69.20 from the year-to-date low of $58. The West Texas Intermediate (WTI) and other benchmarks have continued rising.
Rising geopolitical risks continue to drive investor sentiment. The gold price remains in an unstoppable bull run. Investors are embracing its role as a safe-haven asset amid uncertainty. Other safe-haven assets like the Swiss franc have also jumped.
Geopolitical Tensions Drive Bearish Outlook for Bitcoin Price and ETFs
The ongoing geopolitical risks in the Middle East are highly bearish for the Bitcoin price for two main reasons.
Bitcoin has proven it is not a safe-haven asset. It consistently drops whenever risks rise. For example, the Bitcoin price dropped in April last year when Donald Trump announced his reciprocal tariffs.
It also dropped this month when he warned of tariffs on key US allies like Germany, France, Denmark, and the UK. Also, it plunged during the 12-day war last year.
Second, the war would lead to higher energy prices, which would trigger higher inflation. It’s a move that would make it possible for the Federal Reserve to cut interest rates.
Bitcoin price often does well when the Fed cuts interest rates. The ongoing fears explain why spot Bitcoin ETFs have continued shedding assets this year.
SoSoValue data shows that Bitcoin ETFs shed over $19 million in assets on Wednesday after shedding $147 million a day earlier. The funds shed $278 million in assets after $1.09 billion in December and $3.4 billion in November.
Bitcoin Price Technical Analysis Points to a Crash
BTC price has crashed in recent months. It fell from a high of $128,000 in October. It dropped to a low of $80,400. It has moved upwards in the past few months and formed an ascending channel.
Bitcoin price has formed a giant bearish flag pattern. That’s made up of a long vertical line and an ascending channel. It is now slightly above the lower side of this channel. A bearish flag is one of the most common bearish chart patterns in technical analysis.
The coin has remained below the 50-day and 100-day Exponential Moving Averages (EMA) and the Supertrend indicators.
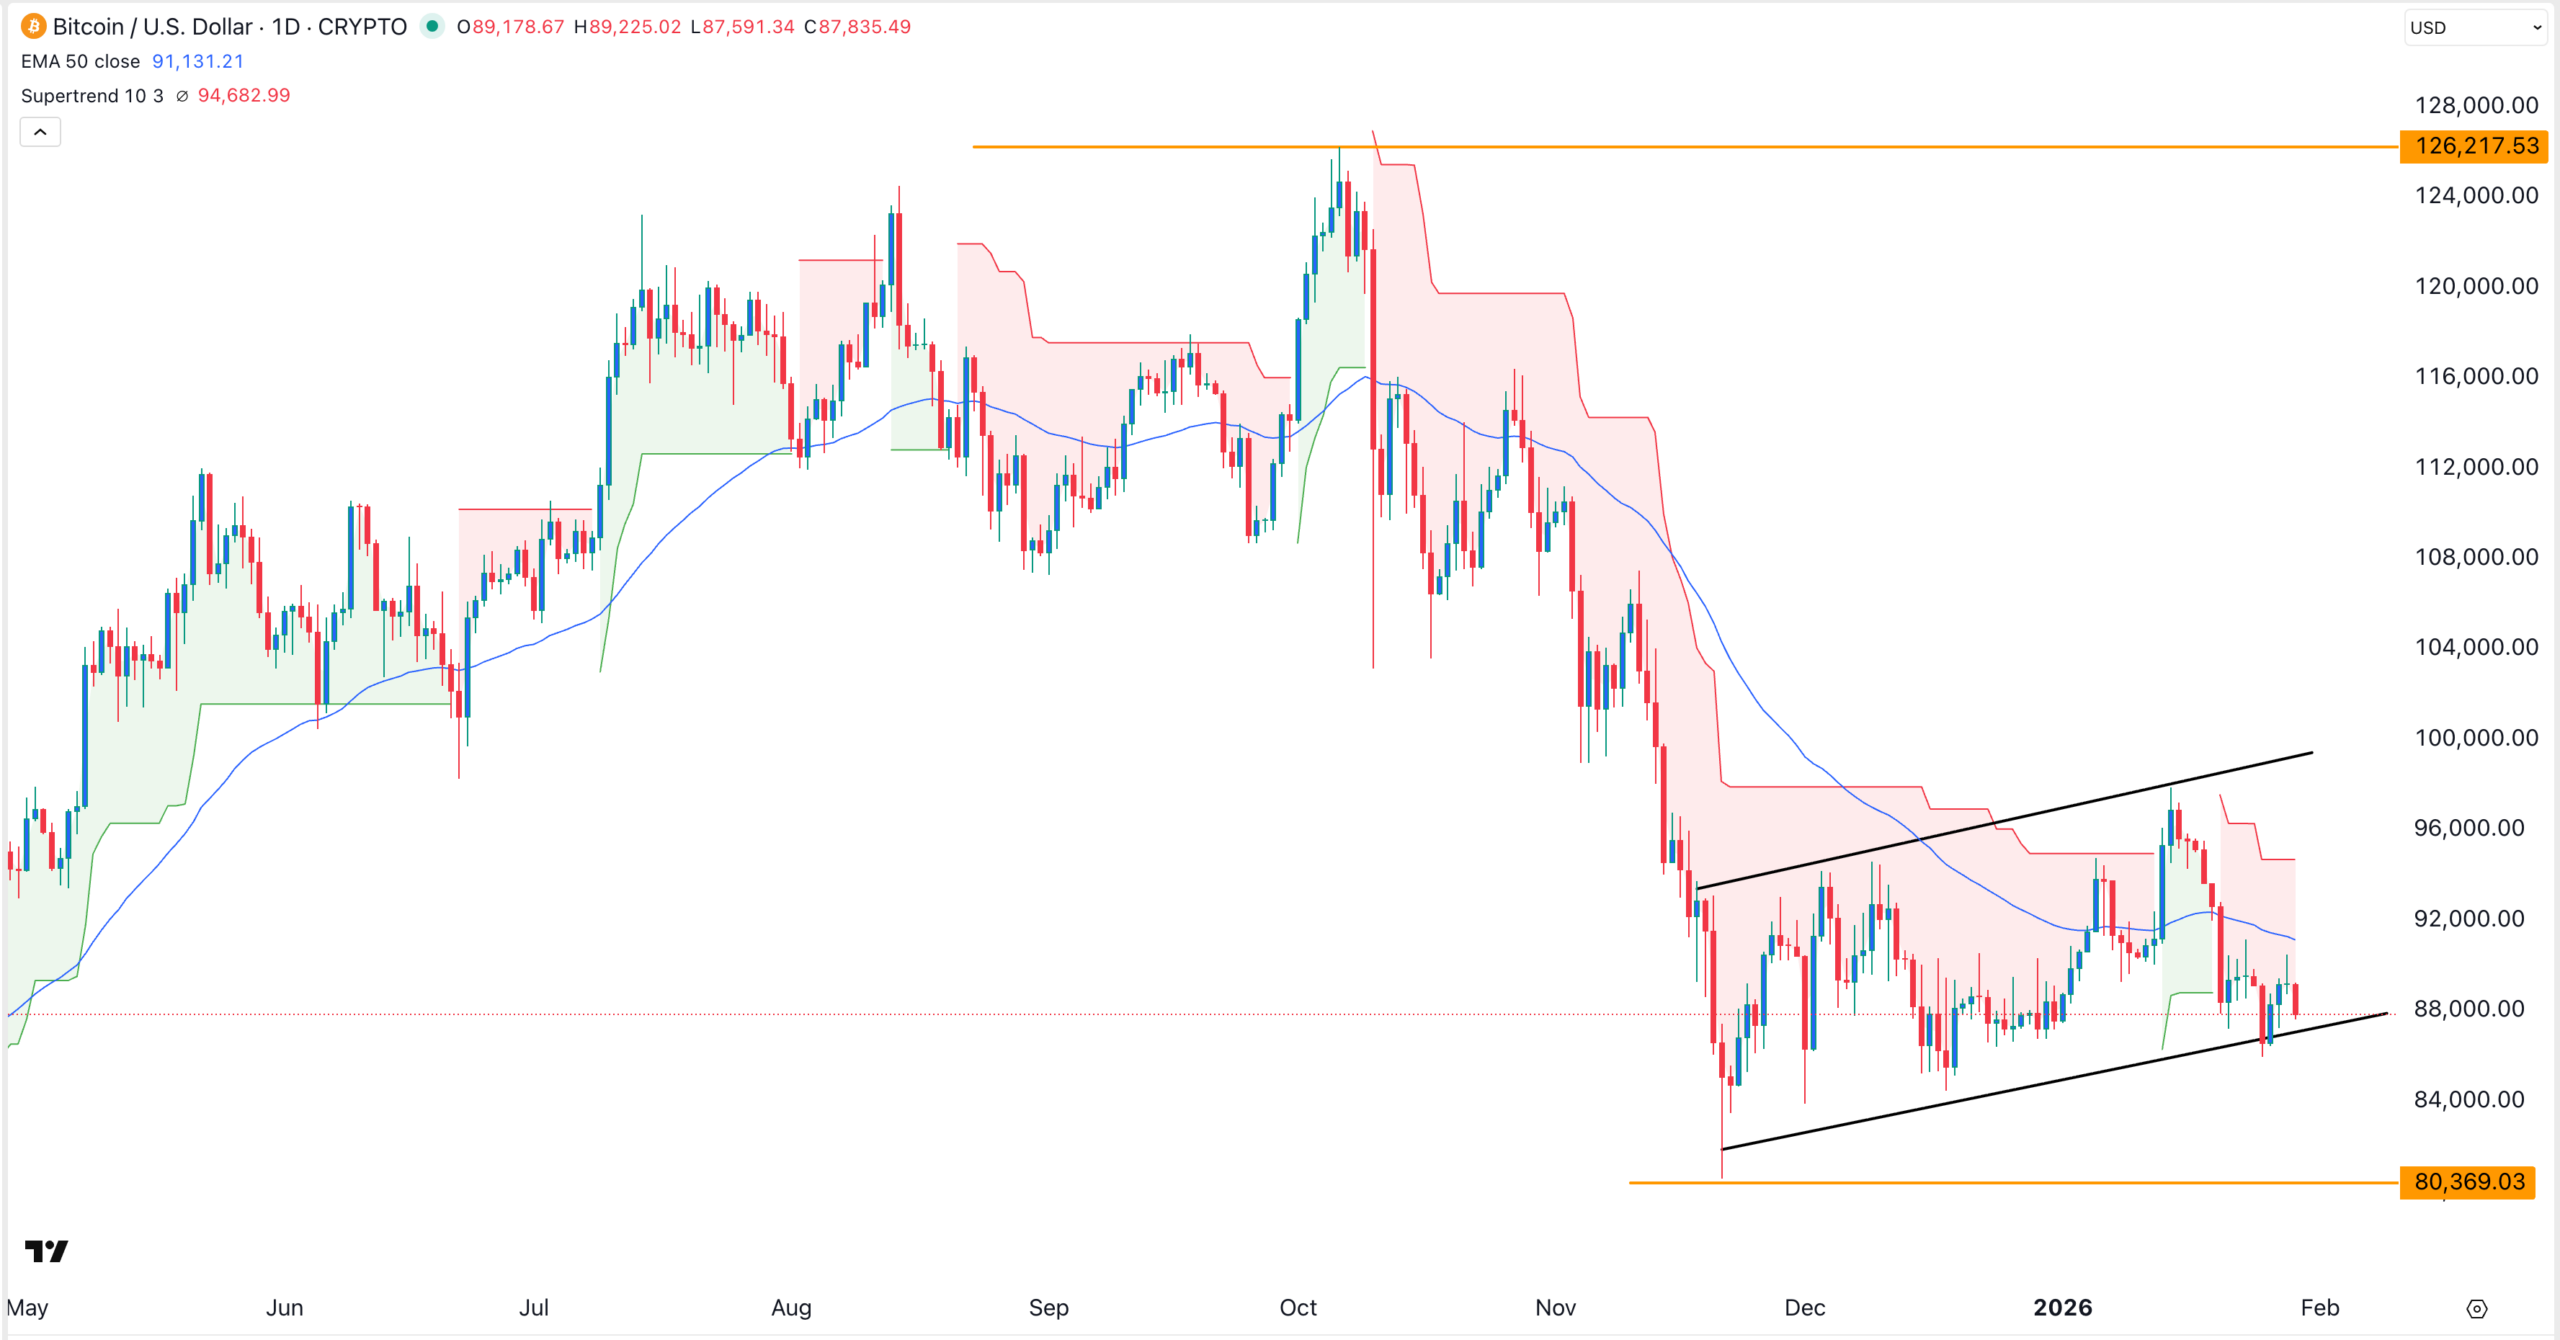
The coin will likely drop further. It may move to the key support at $80,400. This level is about 9% below the current price. A drop below that level will point to more downside, potentially to $74,000, its lowest level in April last year.



