
 Dacity Coin
 Zcash
Zcash Celestia
 Bitcoin
 Pearl
Pearl Injective
 Pons
Pons
- Quant Price down by 10% approx in the current month.
- QNT Price drops below 50 and 20 day EMA and displays death crossover.
- Quant crypto price struggles to defend the $100 support.
Quant Price down 10% in the current month and slipping down by forming lower low swings. QNT Price displayed a death crossover which has hurted the sentiment of long term investors. The price seems to be consolidating in a wide range between $100.00 to $130.00 and likely to break either side soon.
QNT Price is trading below the 50 and 200 day EMA showcase positional and short term trend is in the downward direction. However, the price is near to the lower range support and any positive news can trigger short covering.
Quant Price is trading at $103.90 with an intraday decline of -0.19%. The 24 hour volume to market cap ratio is 0.0073. The pair of QNT/BTC is trading at 0.003844 with an intraday rise of 0.05%.
The chart structure of Quant crypto with BTC pair seems to be in a strong downtrend and no signs of recovery is visible. At the mid of March, QNT Price took support near $110.00 and formed a bullish hammer candle.
It created a hope for the bullish trend reversal and prices gained positive momentum. However, the momentum takes halt near to the 50 day EMA which turns out to be a strong hurdle for the bulls. Slowly prices began to decline and eroded all its previous gains.
Will Quant Price take U-turn from support?
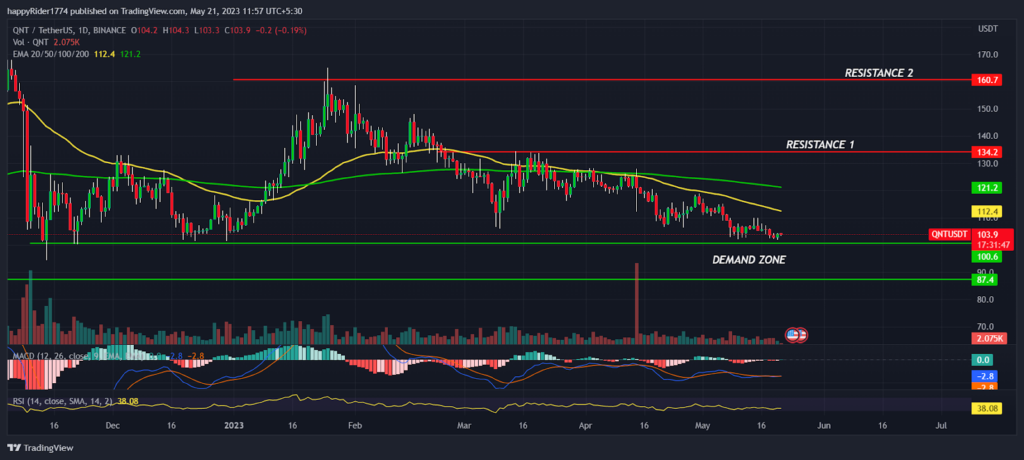
The downfall in Quant price halted near $100.00 and buyers are trying to defend the $100.00 mark. If the overall market sentiment improves then it might positively impact the prices of Altcoins.
If the buyers succeed to push the price above both the EMAs the signs of short term trend reversal will be visible. However, QNT price will pick up momentum only after breaking out of the $134.00 hurdle level.
On the other hand, if the sell off continues and prices drop below $100 the possibility of more downside will open. The technical analysis suggests, Till QNT price holds $100 the probability of rebound remains high and bounce back is possible.
QNT Price on weekly time frame
QNT Price is forming a bearish candle on a weekly time frame and no sign of recovery is visible. Previously, QNT price had formed a double bottom pattern but failed to break out of the neckline hurdle. Since then price has continuously declined indicating bear dominance.
The technical indicators like MACD curve is sloping sideways indicating prices might consolidate for some time in a narrow range. The RSI at 38 near to the oversold territory denotes relief rally may trigger anytime to clear out existing short positions.
Conclusion
Quant Price down 10% in the current month and forming a bearish pattern. However, the price is near to the crucial support and buyers are trying to bounce back. The technical analysis suggests, Till QNT price holds $100.00 level the probability of rebound is high.
Technical levels
Resistance levels: $134.00 and $160.00
Support levels: $100.0 and $87.00
Disclaimer
The views and opinions stated by the author, or any people named in this article, are for informational purposes only. They do not establish financial, investment, or other advice. Investing in or trading crypto assets comes with a risk of financial loss.




