
 Dacity Coin
 Celestia
 Quantus
 Bitcoin
 Pearl
Pearl Pons
Pons Injective
- Mosaic Mineral Corp,’s stock price is currently below the 50 and 100-day EMA levels.
- MOC’s stock price is currently trading at CA$ 0.065.
- Mosaic Mineral Corp (CSE: MOC) live market cap is CA$4.47 Million.
Mosaic Mineral Corp (CSE: MOC) stock price is currently moving in a downward direction. The MOC stock price is making lower highs in the weekly timeframe.
Mosaic Mineral Corp (MOC) stock has a market cap of CA$ 4.47 Million. The 52-week high of the stock is CA$0.026 and the 52-week low is CA$0.05. The P/E ratio of MOC is -4.8 and EPS is -0.018. This denotes that the MOC stock is having negative earnings.
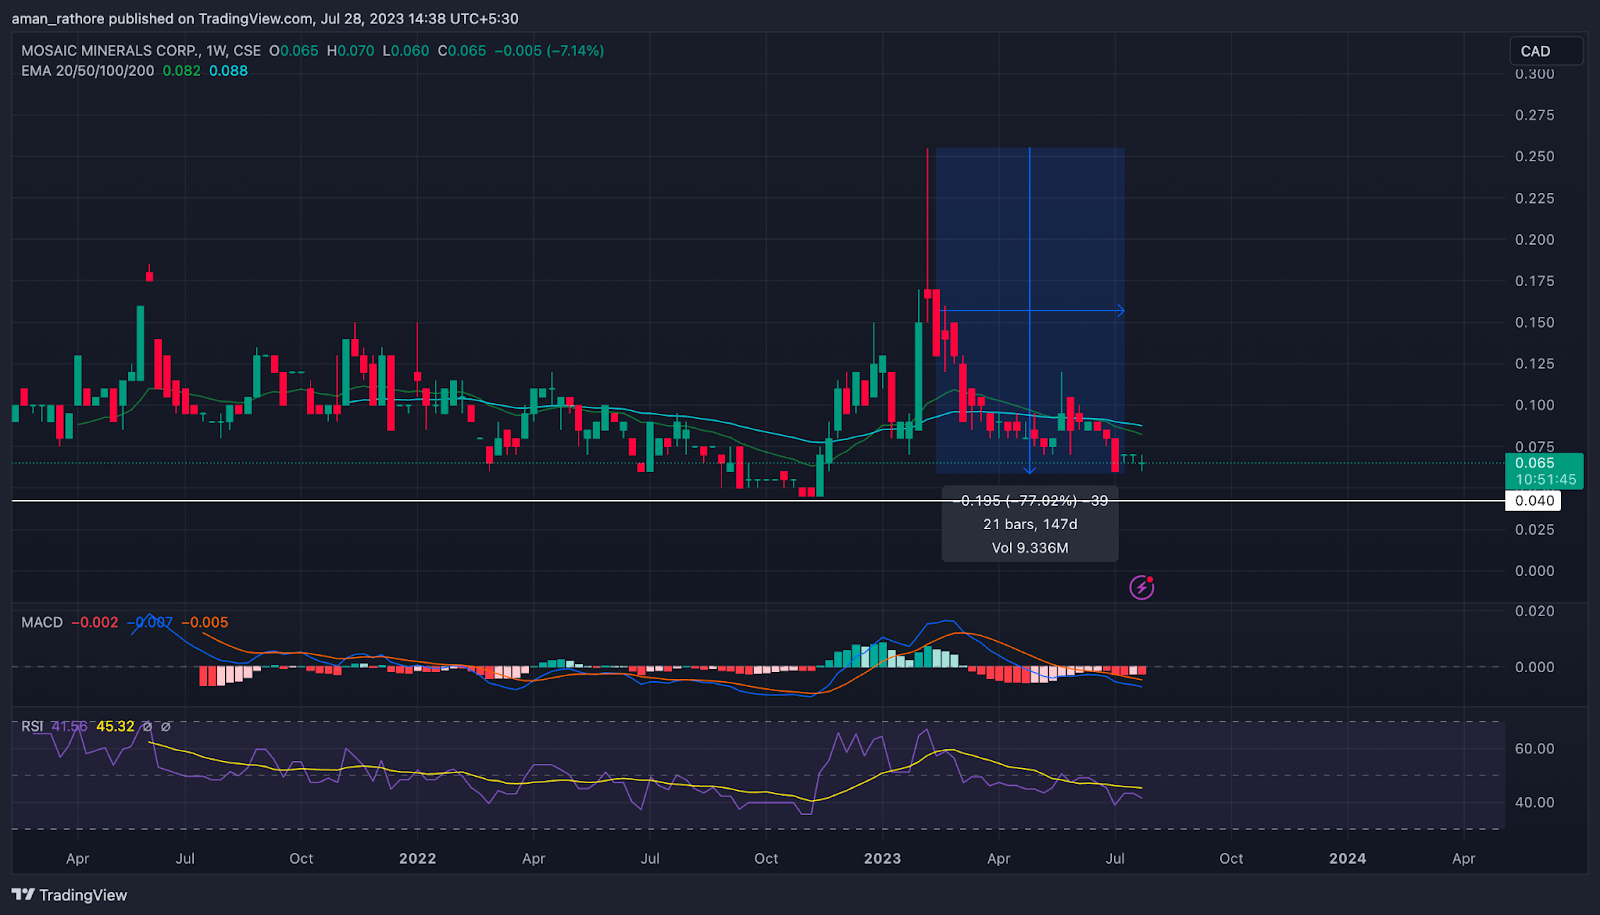
The stock price of Mosaic Mineral Corp (MOC) hit a high of CA$0.026 in February 2023 and later the stock price started declining. The stock price of MOC fell by around -76% in just four months.
Looking at the current market scenario, Mosaic Mineral Corp stock is still falling and the price is forming a negative pattern. The overall structure of the MOC stock is weak and the price is likely to fall in the upcoming days.
As per the analysis, the stock of MOC profit is also declining and the company’s earnings are in negative figures. The overall debt on the MOC stock is also high which might lead to a further fall in the stock price.
Mosaic Mineral Corp (MOC) Stock Price Analysis
EMA
The Mosaic Mineral Corp’s stock (CSE: MOC) is currently trading below both the 50-day and 100-day exponential moving averages of the stock price. This suggests that the stock is now in a weak trend and that a price decline may be imminent.
MACD
A red histogram formation and the MACD line of the MOC stock are both below the signal line. This shows that stock is weak and price is likely to decline in the future.
RSI
For the MOC stock, the Relative Strength Index (RSI) line and the 14-day Simple Moving Average (SMA) line are both near 30. Therefore, a price drop is predicted by the lowering RSI line.
Conclusion
The price research reveals a declining stock price for Mosaic Mineral Corp., and this pattern is anticipated to persist going forward. The MOC price is making lower highs and the indications are heading downward. As a result, it is anticipated that the price of MOC stock would decrease in the upcoming days.
Technical Levels
- Support Level– CA$0.040.
- Resistance Level– CA$0.105.
Disclaimer
The views and opinions of the author, or anyone named in this article, are for informational purposes only. They do not offer financial, investment, or other advice. Investing or trading crypto assets involves the risk of financial loss.




