
 streamoors
 IGNITION
 Sword Inu
 no crying in the casino
 Altai the Tiger
 Pearl
Pearl Pudgy Penguins
- Stellar price (XLM) slid 5.17% in the last 24 hours and is currently trading at $0.1419.
- Stellar (XLM) derivatives data states that a total of $408.92K open interest contracts have been created over the past 24 hours.
XLM is a P2P network that was started in 2014 by Stellar.org. The network connects the world’s financial systems and offers a protocol for payments and finance. The platform transfers money quickly and reliably at a low cost. Stellar links people, banks, and payment processors and allows users to make, send and trade various crypto.
The Stellar price is currently trading at $0.1419 with a decline of 5.17% in the past 24 hours. XLM holds a total market cap of $3.87 Billion and ranks 21st in the crypto market.
XLM token has a trading volume of $137.13 Million with a decline of 7.76% over the past 24 hours. It has over 27.33 Billion tokens in circulating supply. The volume-to-market cap ratio of the XLM token is 3.53% indicating low volatility in the market.
Stellar Price Prediction Using Price Action Strategy
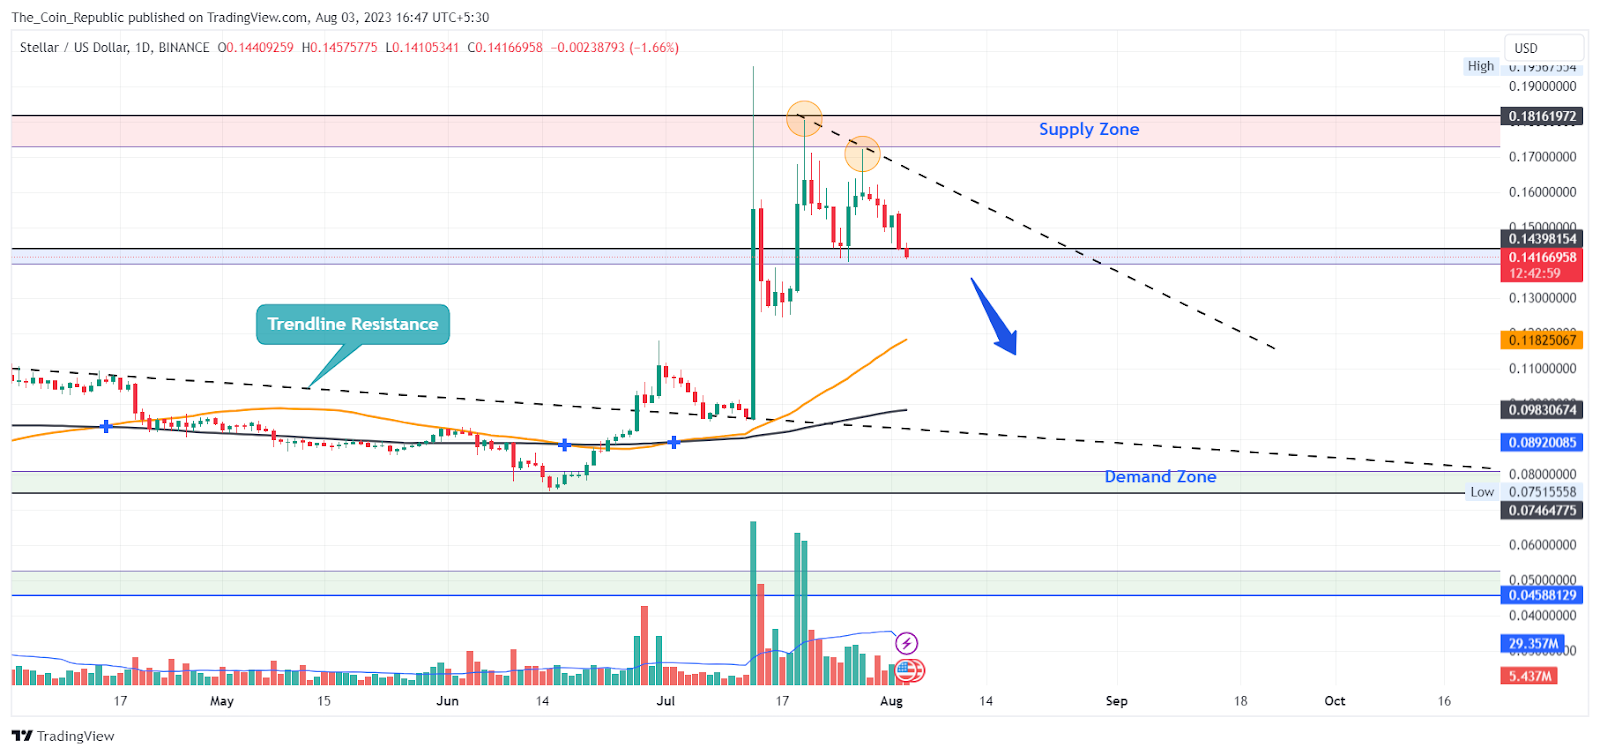
Stellar price analysis reveals that the token was in a correction phase from June 2022 to June 2023 and declined by suffering rejections from a trendline resistance thus forming a descending triangle pattern. Recently, the token made a breakout of descending triangle pattern and surged nearly 80%.
However, the price has suffered rejection from the supply zone and slid nearly 20%. Currently, the price is struggling to sustain near the upper levels but seems to be topping out.
Hence, the price may enter a correction phase as there is a significant decline in the volume observed and the price is forming a lower high. The price is expected to remain in the correction phase until it remains below the supply zone.
XLM Price Forecast from Indicators’ point of view
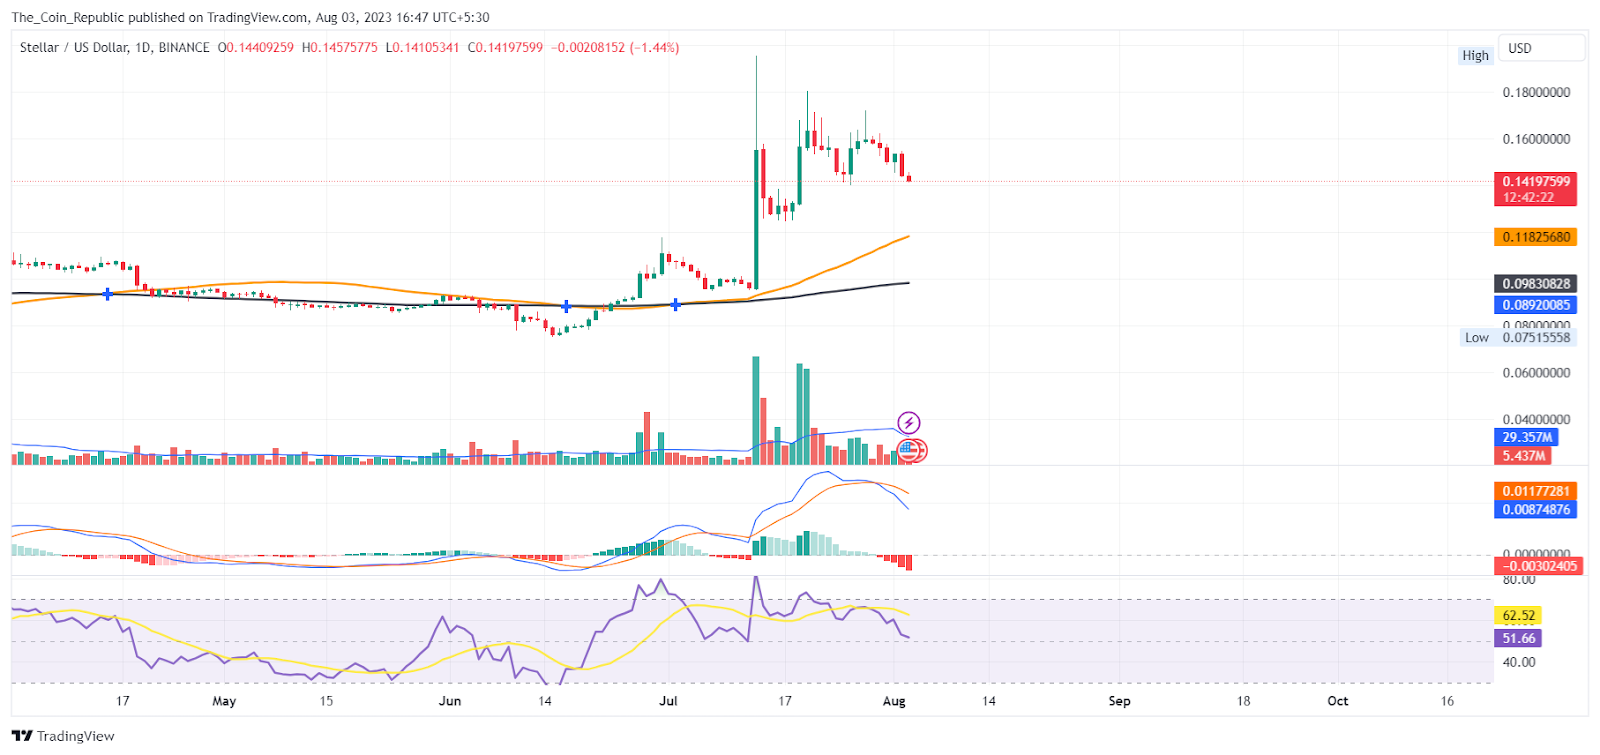
As per the EMA analysis, the XLM price has made a breakout of 50 and 200 EMA both. Hence, the EMAs may act as a support to the price if the price declines.
At the time of publishing, the RSI value of the XLM token is 51.59 and that of the SMA line is 62.52. RSI has suffered rejection after entering the overbought zone and declining which indicates a possible correction in the price.
MACD lines have made a bearish crossover. Also, Histogram bars are being formed below the mean line with increasing height indicating a negative sentiment in the market.
Conclusion
Stellar price prediction concludes that the token was in a correction phase from June 2022 to June 2023 and corrected by suffering rejection from the upper trendline thus forming a descending triangle pattern. Recently, the token made a breakout of descending triangle pattern and surged nearly 80% but suffered rejection from the supply zone. Currently, the price is struggling to sustain near the upper levels and seems to be topping out.
For Now, the price is expected to undergo a correction phase and the price may decline till the previous breakout zone.
Technical Levels
- Support levels: $0.095 and $0.074.
- Resistance levels: $0.155 and $0.181.
Disclaimer
The views and opinions stated by the author, or any people named in this article, are for informational purposes only and do not establish financial, investment, or other advice. Investing in or trading crypto or stock comes with a risk of financial loss.




