
 Dacity Coin
 Zcash
Zcash Sui
Sui Injective
 Quantus
 Pearl
Pearl NEAR Protocol
- The previous closing price for PEP stock was $178.12.
- The basic EPS of PepsiCo Inc. is $5.73 with floating shares of 1.377 Billion.
The dividend paid by the PEP per share in 2022 is $4.53 following a dividend yield for the year of 2.50%. The payout ratio of the company is 70.44% and the dividend pay date is 29/09/2023. The last dividend paid per share was $1.26.
In 2022, the PE ratio for PepsiCo Inc. stock stood at 28.12, indicating a decline of -9.15% compared to the previous year. A high PE ratio can suggest that investors are willing to pay a premium for the stock, potentially considering it to be of higher value. However, it’s important to note that a high PE ratio might also be a sign of overvaluation, as investors are willing to pay more for each unit of earnings generated by the company.
Over the course of a year, the price of PepsiCo Inc. shares has experienced a decline of more than 1.00%. However, the company’s revenue has shown an improvement, increasing from $79.47 billion in 2021 to $86.40 billion in 2022. Additionally, there has been a slight increase in net income, reaching $8.91 billion for the year 2022. This improvement in earnings has also contributed to a slight advancement in the profit margin, which went up from 9.59% to 10.31% in the year 2022.
PepsiCo Inc Debt Analysis
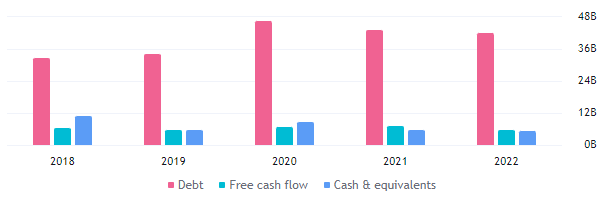
The debt for the company has slightly declined by more than $0.08 Billion in a year from 2021 to 2022, and the free cash flow has also slightly declined from $6.99 Billion to $5.60 Billion. This indicates the good performance of the company in the past year.
PEP Technical Analysis
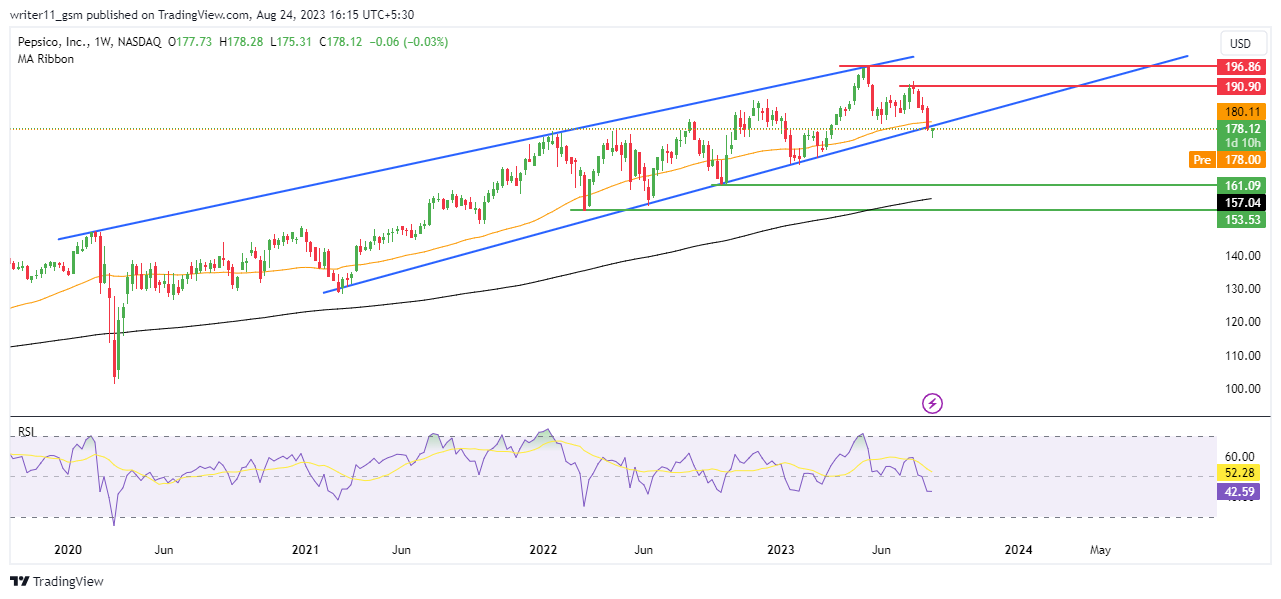
The price of PepsiCo Inc. (PEP) stock has shown a consistent upward movement from lower levels, forming a pattern of higher highs. However, this has led to the development of a rising wedge pattern, which the stock recently broke below, indicating a sell-on-rise situation.
On the weekly charts, the 50-day and 200-day Exponential Moving Averages (EMAs) are in a golden crossover, with the price trading above the 200-day EMA. However, the stock has fallen below the 50-day EMA, indicating potential weakness in the current trend.
The relative strength index (RSI) for PEP shares is currently trading below the 50-level, suggesting a bearish sentiment. Additionally, the RSI has dropped below the 14-day SMA line, further supporting the bearish outlook for the stock.
Technical Overview of PEP Stock
12 indicators are giving a sell signal, 9 indicators are acting neutral, and 5 indicators are giving a signal for buy, which makes the stock bearish on the weekly timeframe, hinting at a further drop in price.
Conclusion
The recent price action of PepsiCo Inc. (PEP) stock has resulted in a breakdown below the rising wedge pattern. Additionally, the RSI is indicating a supportive signal for a potential downtrend. The EMAs are not providing a clear trend direction on the chart.
Given this scenario, it’s likely that PEP stock could sustain its downward movement. The current market conditions suggest a sell-on-rise strategy. A significant change in the trend for the upside might only occur if the stock manages to break above the key resistance level around $191.00. Until then, the price trajectory may continue to decline, potentially reaching lower support levels.
Technical Levels
- The support levels for PEP Stock are – $153.00 and $161.00
- The resistance levels for PEP stock are – $190.00 and $197.00
Disclaimer
The information provided in this article, including the views and opinions expressed by the author or any individuals mentioned, is intended for informational purposes only. It is important to note that the article does not provide financial or investment advice. Investing or trading in cryptocurrency assets carries inherent risks and can result in financial loss.




