
 Celestia
 Quantus
 Starknet
 Pearl
Pearl LayerZero
 Lighter
 Bitcoin
- The previous closing price for USB stock was $36.25.
- The basic EPS of U.S. Bancorp is $3.60 with floating shares of 1.533 Billion.
In 2022, U.S. Bancorp paid a dividend of $1.88 per share, resulting in a dividend yield of 4.31% for the year. The company’s payout ratio was 50.92%, indicating the portion of earnings allocated to dividends. The most recent dividend, paid on July 17, 2023, amounted to $0.48 per share.
The price-to-earnings (PE) ratio for U.S. Bancorp’s stock in 2022 was 9.96, reflecting a 7.33% increase from the previous year. A high PE ratio can suggest that investors are willing to pay a premium for the stock, but it might also indicate overvaluation.
The stock price of U.S. Bancorp has experienced a decline of over -23.89% within a year. Despite a revenue increase from $21.78 billion in 2021 to $27.40 billion in 2022, there was a significant drop in net income to $5.80 billion in 2022. This decline also affected the profit margin, which decreased from 36.38% to 21.16% in 2022.
U.S. Bancorp Debt Analysis
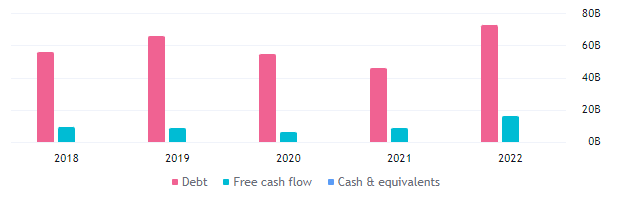
The debt for the company has increased by more than $26 Billion in a year from 2021 to 2022 and the free cash flow has advanced from $8.18 Billion to -$15.35 Billion. This indicates the poor performance of the company in the past year. The following price data points could be the reason for the decline in price in the last year.
USB Technical Analysis
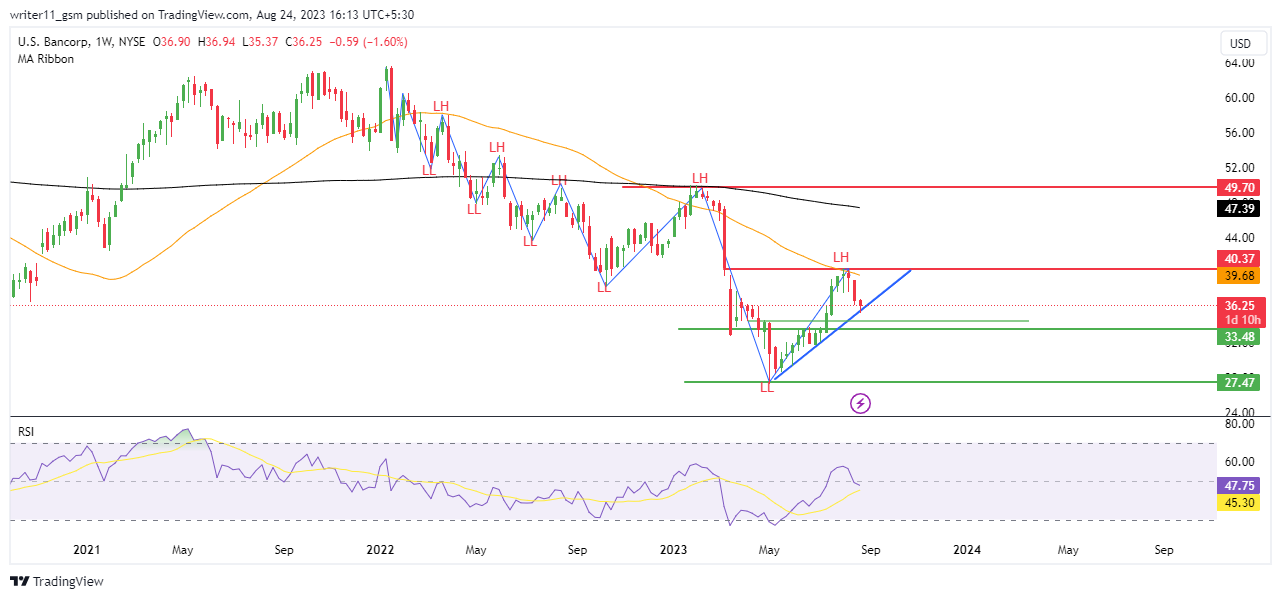
The price of USB stock is consistently declining from the higher levels leading to the formation of a lower lows pattern and it has recently bounced back from the previous swing low. If the price sustains above the level of $33.00, then it can result in a double bottom pattern and this could lead to a change in the trend of the USB stock.
The 50-day and the 200-day Exponential Moving Averages(EMA) are trading in a death crossover on the weekly charts and the price is also declining, trading below the EMAs, leading to a downtrend.
The RSI for the USB share is currently trading at the levels of 50 and has broken above the 14-day SMA line. If the RSI manages to sustain above the 50-level then we can get to see a good upward move in the stock in the upcoming days.
Technical Overview of USB Stock
14 indicators are giving a sell signal, 9 indicators are acting neutral, and 3 indicators are giving a signal for buy which makes the stock bearish on the weekly timeframe, suggesting a further drop in price.
Conclusion
U.S. Bancorp stock price has been consistently declining from higher levels, resulting in a downtrend and the EMA is also acting bearish. The RSI is acting uncertain and the price data of the stock looks weak on the charts.
Therefore, USB stock may continue to decline as it is in a consistent downtrend and the financial data of the company is also poor but further downfall is expected only below the level of $33.00 and if the market sustains above the same level then it may reverse and continue in an uptrend.
Technical Levels
- The support levels for USB Stock are – $27.00 and $33.00
- The resistance levels for USB stock are – $40.00 and $49.00
Disclaimer
The information provided in this article, including the views and opinions expressed by the author or any individuals mentioned, is intended for informational purposes only. It is important to note that the article does not provide financial or investment advice. Investing or trading in cryptocurrency assets carries inherent risks and can result in financial loss.




