
 Altai the Tiger
 IGNITION
 streamoors
 Sword Inu
 NEAR Protocol
 Injective
 Quantus
- The PCT price is trading at $9.23.
- The stock value is sustaining above the $8.57 support after a breakout.
John Scott founded PureCycle Technologies Inc. (NYSE: PCT) in September 2015. The company engages in the recycling of waste polypropylene into virgin polymers. It carries out the recycling process in two steps, which are Feed Pre-Processing and the use of the technology for purification.
PureCycle Technologies (PCT) Stock: Technical Analysis
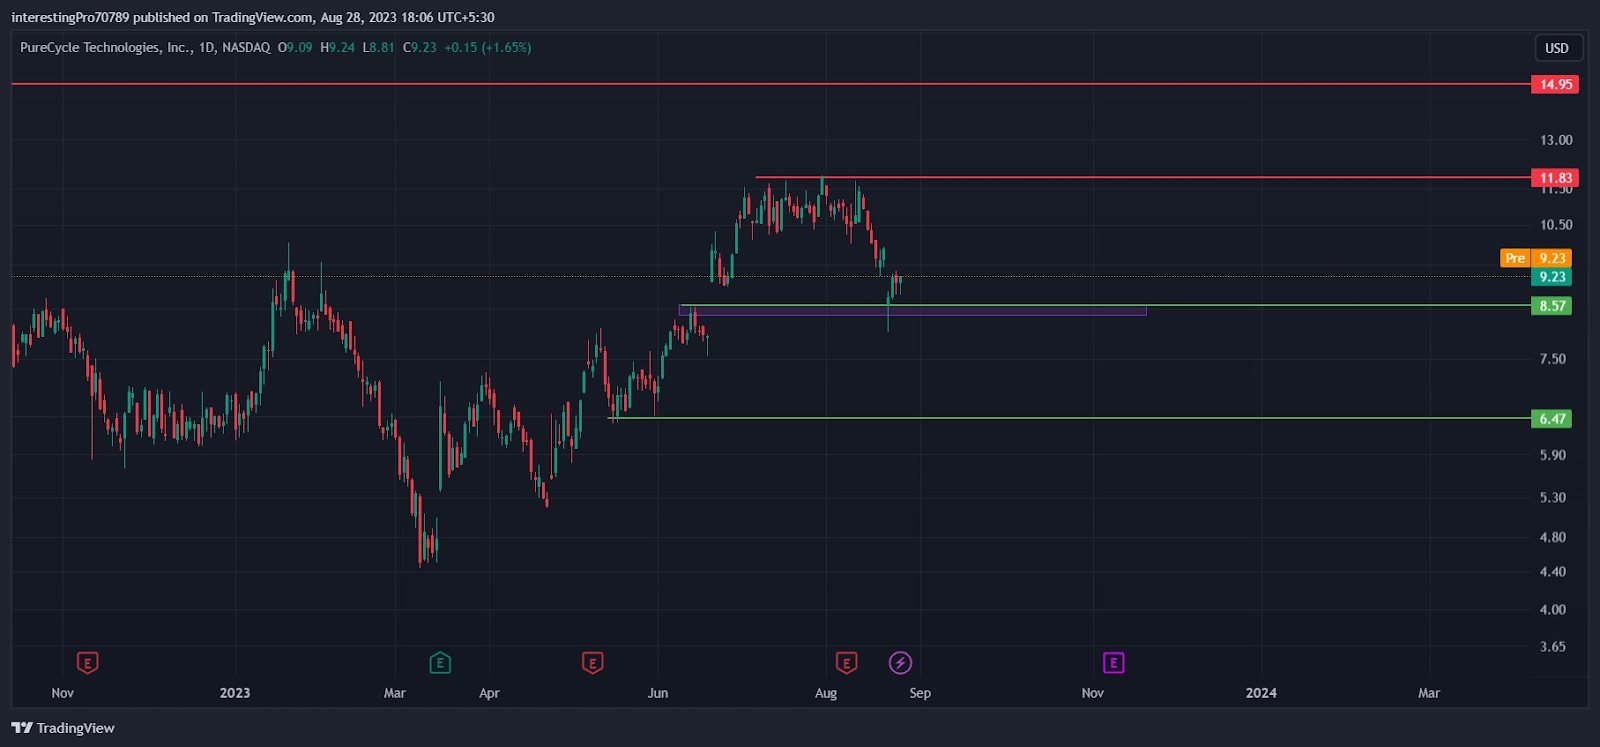
PureCycle Technologies Inc. stock is currently trading at $9.23 with an average volume of 2.995 Million. It has a market capitalization of 1.514 Billion Dollars.
In March 2023, the PCT price formed support of $4.52 and commenced a bullish rally from there. The price started going up and forming a higher-high structure in the market.
On 21 June 2023, the price showed a gap-up scenario. It rallied in the upward direction without filling the gap. It started falling after reaching to the $11.83 level. The buyers made many attempts to give the breakout of the $11.83 level. That was not enough and the price faced rejection every time it reached there.
It tried to close above $11.83, but failed and started falling again. Recently, the price has filled the gap which was left before.
Currently, the price is sustaining above the $8.57. It has formed a strong bullish candle with a huge volume. If the price commences a bullish rally from here and breaks the $11.83 resistance, it mayy rise to $14.95. That will act as its next resistance.
If it doesn’t and and breaks below $8.57, a bearish move can be seen by the seller to $6.47.
Technical Indicators’ Prediction About the Current Trend
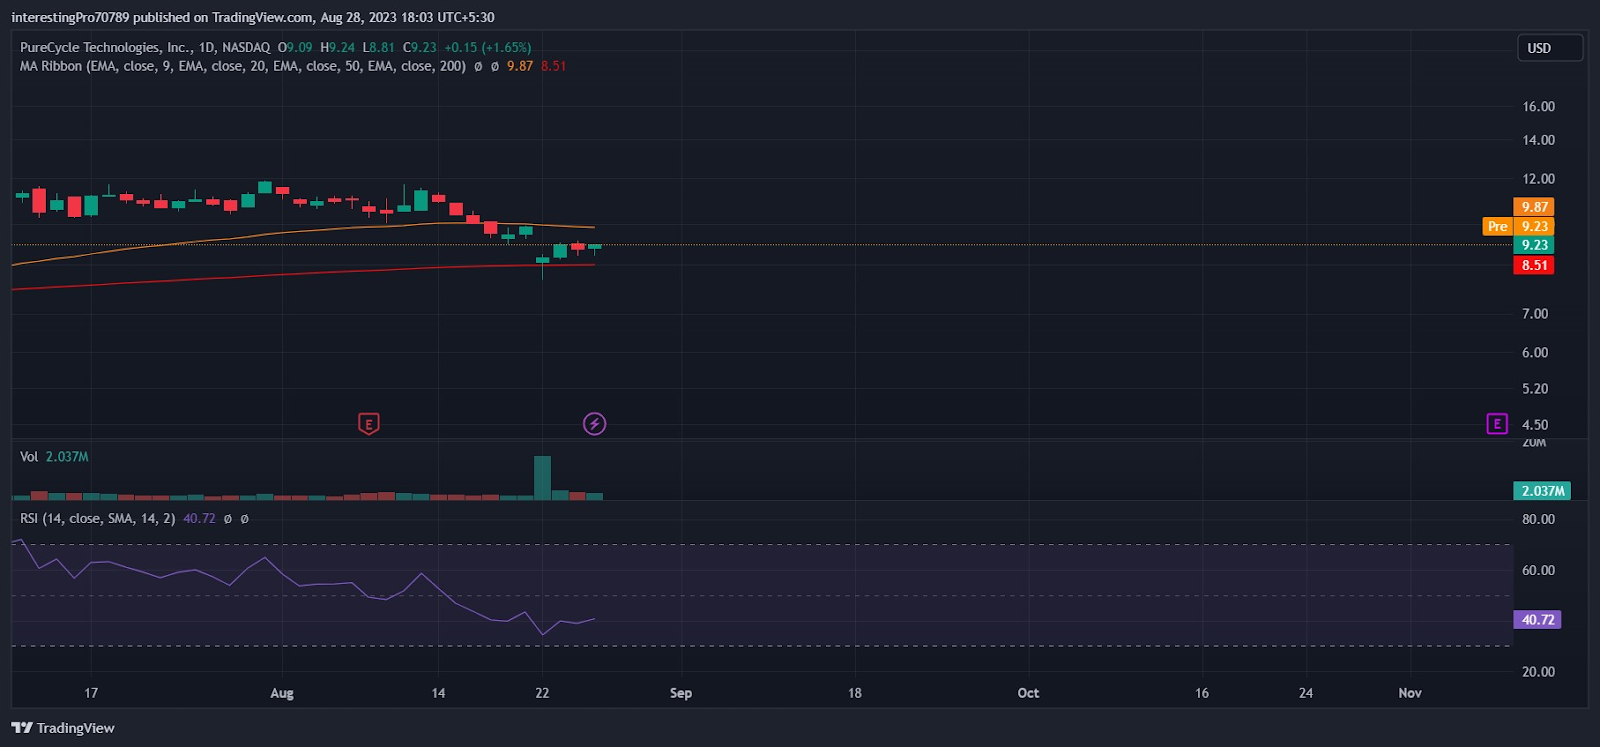
The 50-EMA (yellow line) is at $9.87 and the 200-EMA (red line) is at $8.51. EMA has shown a golden crossover recently, where the 50 EMA has intersected the 200 EMA from downside to upside. The price is currently trading in between the 50 and 200 EMA and it has taken support from the 200 EMA. That indicates the price is the indecisive range. It can still be in bullish sentiment if it closes above the 50 EMA.
The relative strength index is at 40.72. The RSI is in neutral territory and its line is trending in the upward direction.
Conclusion
The overall PCT stock chart is bullish. The price has formed a strong bullish candle at the $8.57 support and is sustaining over it. If it commences a bullish rally from here and gives the breakout of $11.83 resistance, the bullish trend will go on.
But if the price closes below the $8.57 support, it may fall to $6.47 support.
Technical levels
Resistance levels: $11.83 and $14.95.
Support levels: $8.57 and $6.47.
Disclaimer
The views and opinions stated by the author, or any people named in this article, are for informational purposes only. They do not establish financial, investment, or other advice. Investing in or trading crypto assets comes with a risk of financial loss.



