
 streamoors
 IGNITION
 Quantus
 Sui
Sui Pearl
Pearl Zcash
Zcash Aerodrome Finance
- The IHG stock price is trading at 5878 GBX.
- The company stock price is currently sustaining above the 5792 GBX resistance after a breakout.
The Intercontinental Hotels Group (LSE: IHG) was established in 1777. It is a British hospitality company that owns and operates hotels. The company owns many hotel brands.
The Intercontinental Hotels Group (IHG) Stock: Financial Analysis
The Intercontinental Hotels Group has maintained an impressive revenue report since 2020. Its revenue was only 725.70 Million GBP. It grew to 3.22 Billion GBP in 2022.
The company’s EPS is also growing at an impressive rate over the last three years. The firm’s EPS in 2020 was about 0.17 and in 2022 the EPS was 2.28.
The company has paid above 60 dividends in the last two years.
The Intercontinental Hotels Group (IHG) Stock: Technical Analysis
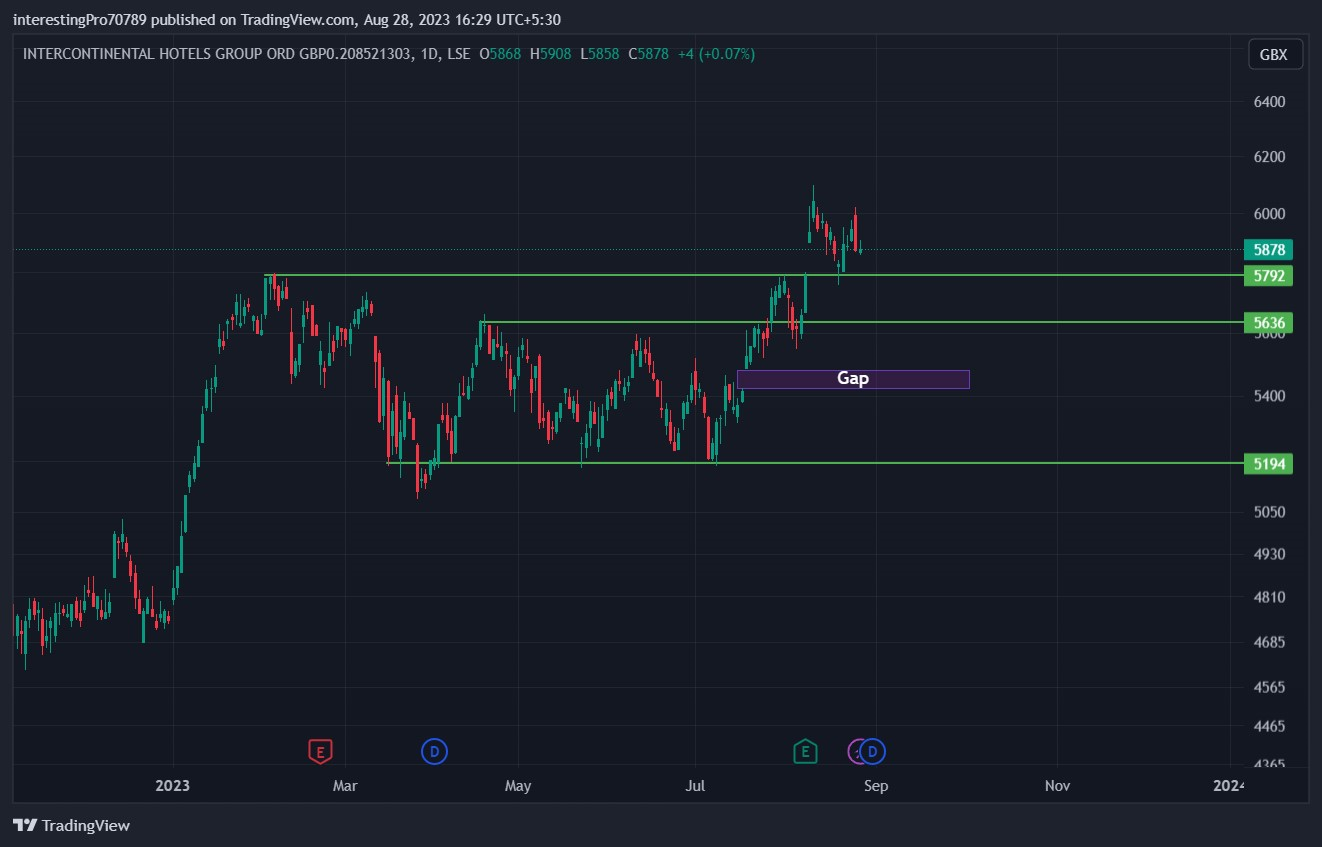
Intercontinental Hotels Group stock is currently trading at 5878 GBX with an average volume of 289.29K. It has a market capitalization of 9.84 Billion GBP.
The IHG stock commenced a solid bullish rally to 5792 in December 2022. The price after reaching there got exhausted and started falling. It fell to 5194 GBX.
The price commenced a bullish rally from 5194 GBX and reached 5636 GBX. It faced rejection from there and went back to 5194 GBX support. The price traded between those two levels for 5 months.
In July 2023, the IHG price again commenced a bullish rally from 5194 GBX support to 5636 GBX resistance with a gap left in the chart. The buyers were dominating over the price. They gave the breakout of the 5636 GBX resistance and 5792 GBX resistance also.
The price reached an all-time high of 6100 GBX and faced rejection from there. It is currently trading above the 5792 GBX support. If it does not sustain over the 5792 GBX, it may fill the gap!
The buyers are dominating the current scenario. The price may sustain above 5792 GBX and give the breakout of the all-time high of 6100 GBX. The bullish momentum will be visible on the IHG chart if the price touches an all-time high level.
Technical Indicators’ Prediction About the Current Trend
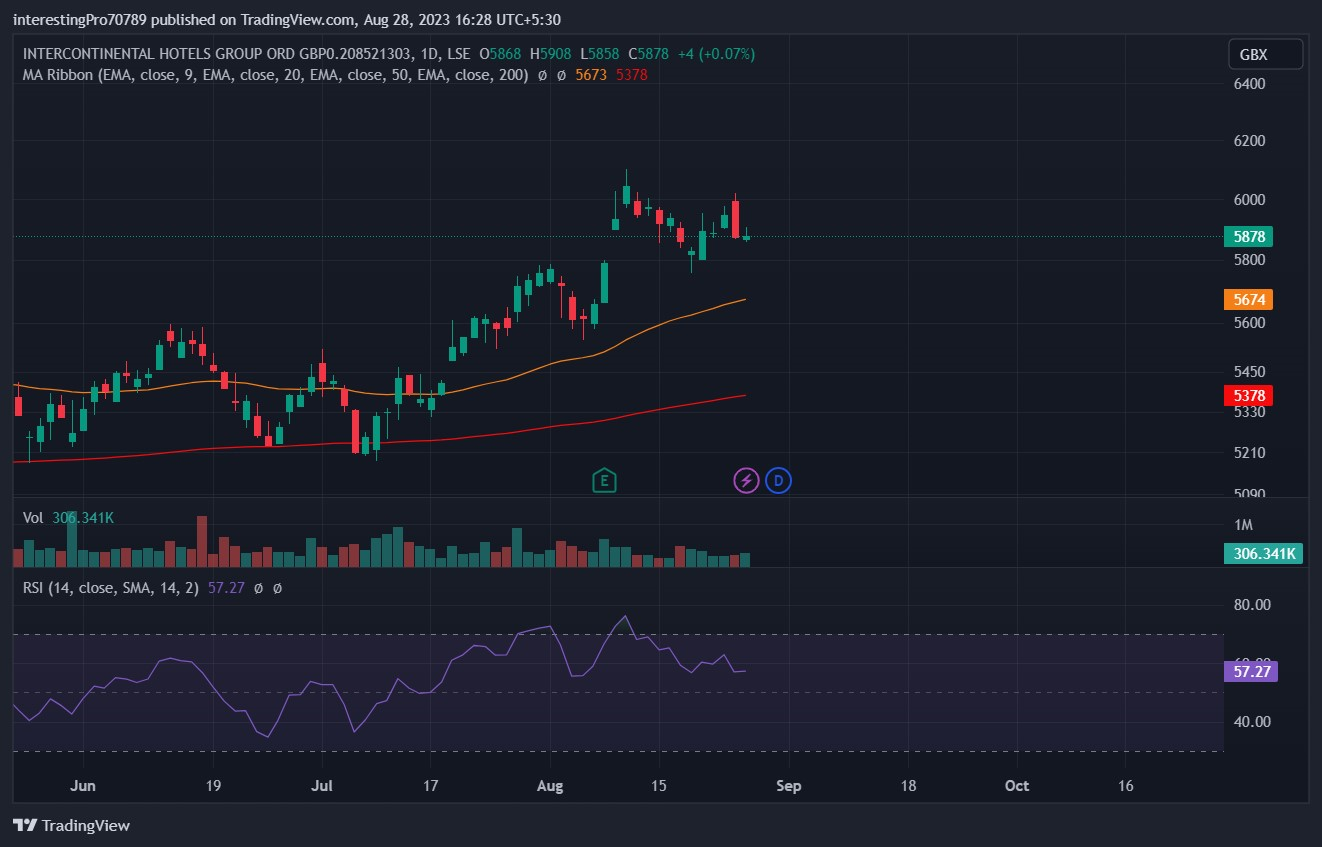
The 50-EMA (yellow line) is at 5674 GBX and the 200-EMA (red line) is at 5378 GBX. The price of IHG is trading above the 50 and 200 EMA. That indicates the price is in bullish sentiment and is under the control of buyers.
The relative strength index is at 57.27. The RSI is in neutral territory for now. It indicates the price is getting pressure from buyers as well as sellers.
Conclusion
The IHG chart is in bullish sentiment at the time of writing this post. It has given the breakout of 5792 GBX resistance and currently sustaining above it. All the indicators mentioned above for IHG price future trends are bullish or neutral!
Technical levels
Resistance levels: 6100 GBX
Support levels: 5792 GBX
Disclaimer
The views and opinions stated by the author, or any people named in this article, are for informational purposes only. They do not establish financial, investment, or other advice. Investing in or trading crypto assets comes with a risk of financial loss.



