
 Altai the Tiger
 IGNITION
 streamoors
 Sword Inu
 NEAR Protocol
 Injective
 Quantus
- The ASHM stock price is trading at 190.9 GBX
- The company stock is in a parallel channel close to its previous low.
The Ashmore Group Plc was founded in 1992. It is a British investment company that deals in the provision of investment management services. The firm provides a core investment over external debt, local currency, corporate debt, blended debt, equities, alternatives, overlay and liquidity, and multi-asset.
Ashmore Group (ASHM) Stock: Financial Analysis
The Ashmore Group’s revenue report has not been impressive from 2020 to 2022. Its revenue has declined by 0.20% during the last three years.
The estimated revenue of Ashmore company in 2023 can be around 196.91 Million GBP. It will be lower than the 2022 revenue.
The company dividend payout ratio is good as it has given over 40 plus dividends over the last 6 years.
Ashmore Group (ASHM) Stock: Technical Analysis
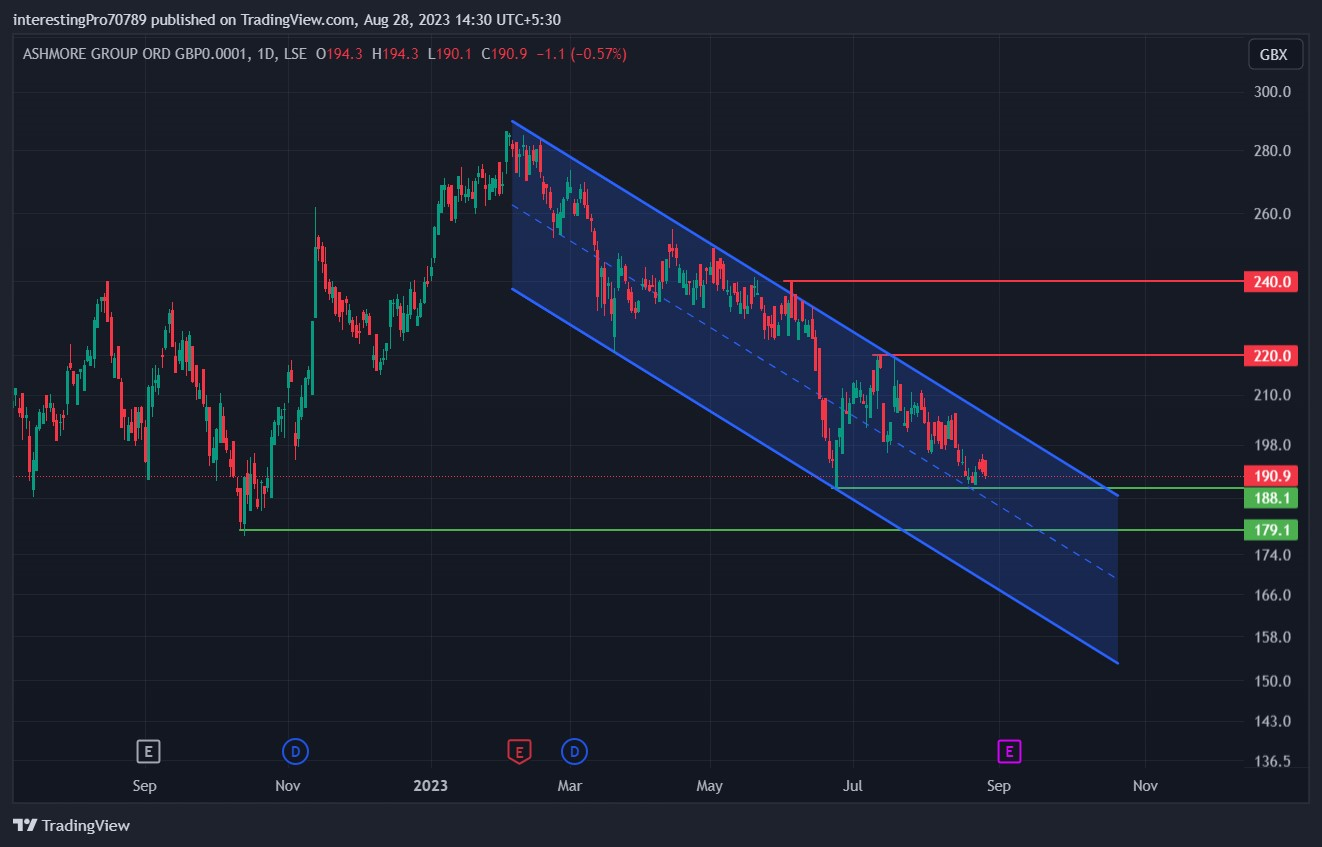
Ashmore Group stock is trading at 190.9 GBX with an average volume of 236.24K. Its market cap is 1.261 Billion GBP.
The ASHM stock price formed support of 179 GBX in 2022 and commenced a bullish rally. The price reached 286.4 GBX, taking only one pullback. The price got exhausted after reaching there and started falling.
Ashmore Group Price was sustained above 224.8 GBX In March 2023 for over four months. In June 2023, the price gave the breakdown of 224.8 GBX. It continued its downtrend to 188.1 GBX.
The ASHM price started falling in a Higher low structure, breaking every recent low it had made.
The price is currently trading inside a parallel channel with a higher low formation. It is very close to the recent low (188.1 GBX). So, if the price breaks below the recent low of 188.1 GBX, it may continue the downtrend with a higher low formation to 179.1 GBX.
Suppose the price bounces back from 188.1 GBX and gives the breakout of the recent high of 220 GBX, it may commence a bullish move to 240 GBX.
Technical Indicators’ Prediction About the Current Trend
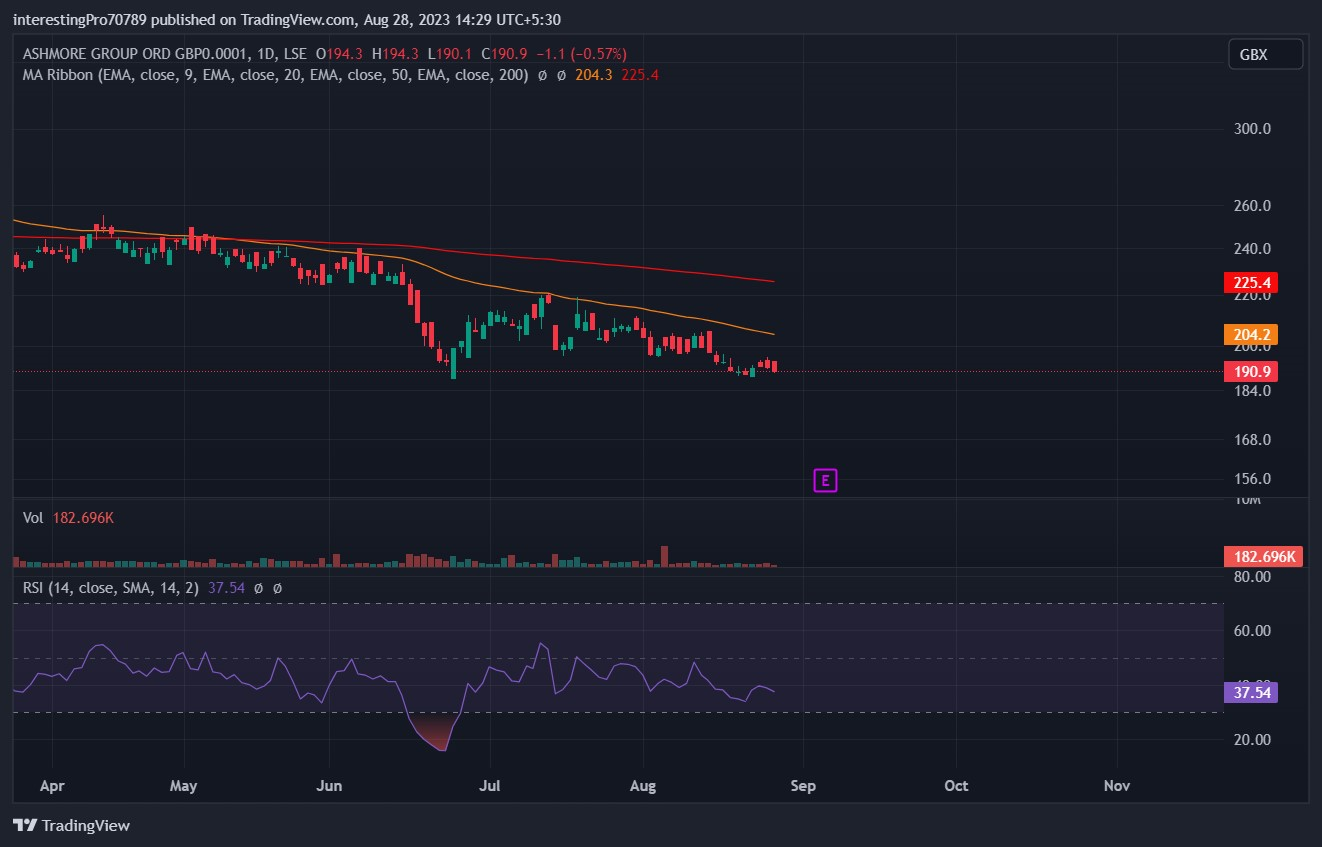
The 50_EMA (yellow line) is at 204.2 GBX and the 200-EMA (red line) is at 225.4 GBX. The Ashmore Group stock Price is trading below the 50 and 200 EMA. It indicates that the price is in a bearish sentiment.
The relative strength index is at 37.54. The RSI line is in bearish territory. That indicates the seller’s pressure over the price.
Conclusion
The Ashmore Group Price is in bearish sentiment at the time of writing. The price is trading in a parallel channel. It is very close to its previous low made by the price. If it breaks the previous low, it can continue the downtrend. The price must give the breakout of the previous high at 220 GBX to commence a bullish rally.
Technical levels
Resistance levels: 220 GBX and 240 GBX.
Support levels: 188.1 GBX and 179.1 GBX.
Disclaimer
The views and opinions stated by the author, or any people named in this article, are for informational purposes only. They do not establish financial, investment, or other advice. Investing in or trading crypto assets comes with a risk of financial loss.



