
 Dacity Coin
 Zcash
Zcash Celestia
 Bitcoin
 Pearl
Pearl Injective
 Pons
Pons
- The price is up by 3.97% in the last 24 hours.
- The coin price is trading at $0.0002568.
- This token has traded with a volume of $106,471,187 in the last 24 hours.
eCash (XEC) Coin: Technical Analysis
Currently, the XEC token price is trading at $0.00002568 with a market capitalization of $3,751,990,276 and with an average volume of $3.388 Million.
In July 2023, the price formed support at $0.00001921 and initiated a bullish rally. The coin price started to move in the upward direction forming a strong bullish candle. It went up to $0.00004572, which was also the 2023-year high.
As soon as the price reached its annual high, it encountered resistance and began to decline. The XEC price started falling and was now between $0.00002879 and $0.00003266 range. It gave the range breakdown in August 2023 and fell to the $0.00002210 support zone. The XEC coin price is now holding above the $0.00002210 support level.
XEC’s Price again initiated a bullish rally and went to $0.00002879 resistance. Currently, the XEC price is facing rejection from the resistance. If the price falls to $0.00002210 support and gives the breakdown of the support, it may fall to its next support at $0.00001921.
However, If the price forms a strong bullish candle and gives a breakout of $0.00002879 resistance, it may rise to $0.00003266 resistance.
Technical Indicators About The Current Trend
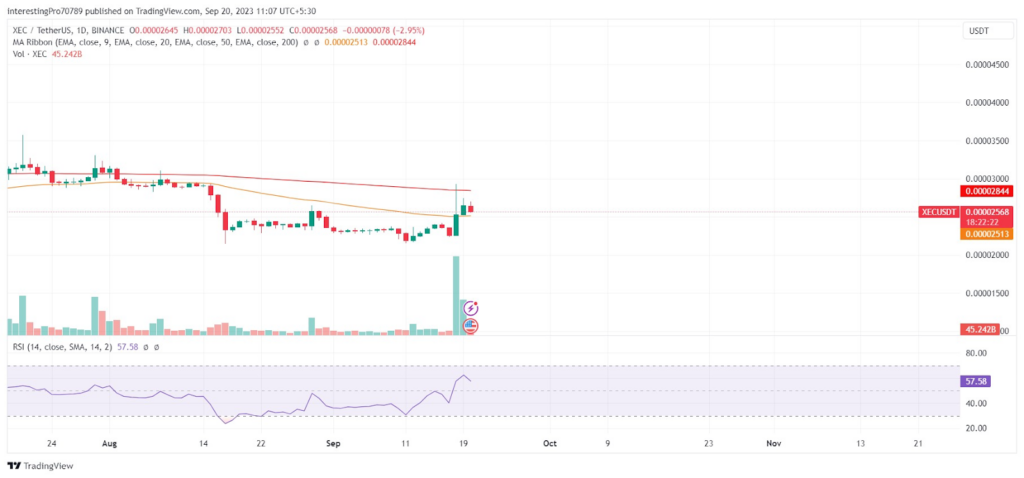
The eCash price is trading between 50 and 200 EMAs. It indicates the indecisive behavior of the price due to the equal pressure from buyers as well as sellers.
The relative strength index is at 57.92. The RSI line is in bullish territory, but it is sloping downwards. It indicates that the buyers are still in control. However, the downward sloping of the RSI line indicates that buyers can be overpowered by sellers if the RSI line crosses below the 50 RSI level.
Conclusion
The overall chart of the eCash token is neutral. Its price is trading in a wide range of $0.00002879 to $0.00002210. If the price forms a strong bullish candle and gives a breakout of $0.00002879 resistance, it may rise to $0.00003266 resistance.
However, If the price falls to $0.00002210 support and gives the breakdown of the support, it may fall to its next support at $0.00001921.
Technical levels
Resistance levels: $0.00002879 and $0.00003266.
Support levels: $0.00002210 and $0.00001921.
Disclaimer
The views and opinions stated by the author, or any people named in this article, are for informational purposes only. They do not establish financial, investment, or other advice. Investing or trading comes with a risk of financial loss.




