
 Altai the Tiger
 Sword Inu
 streamoors
 IGNITION
 NEAR Protocol
 Pearl
Pearl Injective
- The Snowflake stock has been consolidated at the lower level for more than a year.
- HSBC rating firm has given a “buy” rating to the stock with a target price of $201.
- SNOW’s share price has surged by over 6% in the previous trading session.
The current market price of the Snowflake stock is $159.95.
Snowflake stock price surged by over 6% in the previous trading session. The stock price has formed a bullish Marubuzo candlestick on the daily chart. The stock price declined by over 60% since 2022. This decline could be triggered because of the falling net income of the company over the quarters.
Snowflake company has marginally improved its revenue over the period. The company has witnessed a jump of over 66%, 53%, 47%, and 35% (YoY) in its revenue in the last 4 quarters. The Snowflake company maintained its net debt as the company is in a cash surplus of $3.76 Billion.
SNOW stock price has formed an inverted flag and pole pattern. The resistance level of the pattern is present near the $188 level. If one considers the support area for the stock, then it is present near the level of $143. HSBC rating firm has given a “buy” rating for the stock with a target price of $201.
Synopsis of the Snowflake Stock Chart
SNOW stock price has taken multiple support at the $143 level which can act as a crucial support for the price. The stock has surged from the inverted flag and pole support trendline and the stock price has recovered over 13% from lows. SNOW stock has engulfed the whole body of the previous candle which indicates a strong bullish momentum.
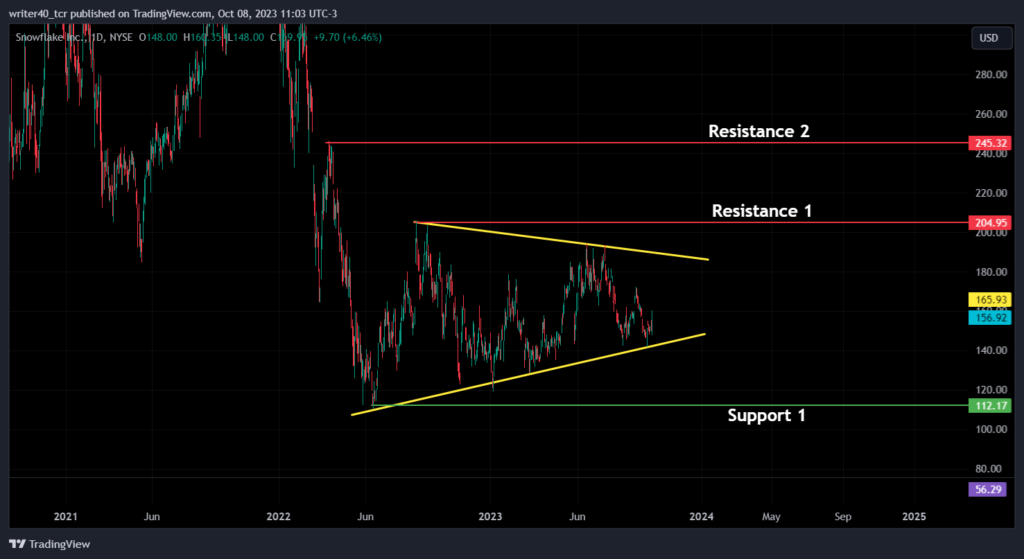
If one considers the resistance for the stock, it is present near the level of $205. The other resistance level for the stock is present at the $245.32 level. The support level for the price is present at $112.17.
What Do the Indicators for SNOW Say?
Bollinger Band
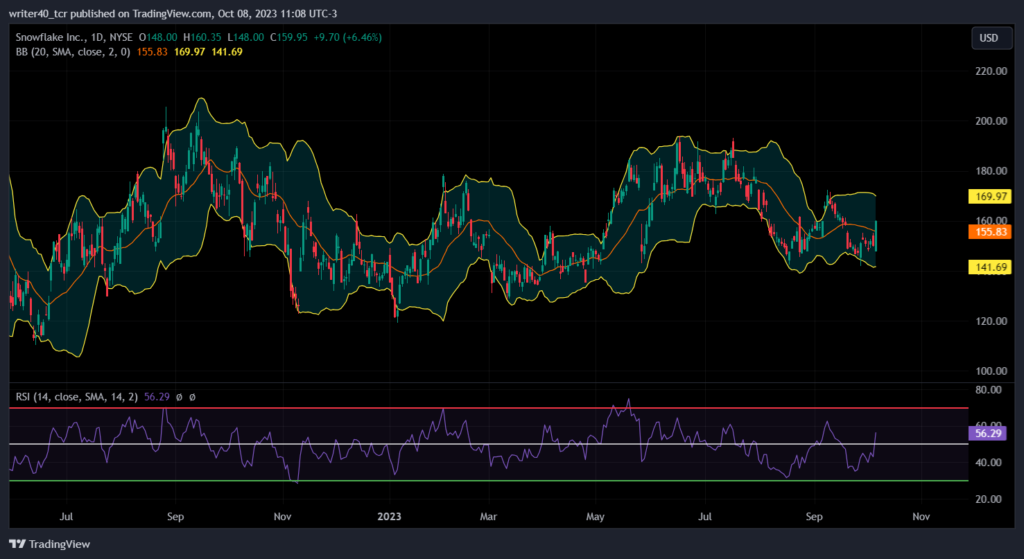
The last trading session’s candle has crossed the median line of the Bollinger band indicators. This indicates that the price has turned bullish according to the indicators. The upper level of the Bollinger band is present at $169.97, which can act as resistance. The lower level of the band is present at the $141.69 level which can act as support.
Relative Strength Index (RSI)
The relative strength index is currently placed at the level of 56.29. This shows that the price has gained some momentum on the bulls’ side. The slope of the RSI is curving upward which is also a bullish sign for the price.
Conclusion
It seems that the SNOW stock price has tested the upper level of the pattern only twice. The possibility is higher for the price to face rejection for the third time. If the stock price breaks the pattern on the upside, then it can try to achieve the level of $204.95. If the price breaks the pattern on the downside, then it can try to achieve the level of $112.17.
Technical Levels
Resistance Levels: $204.95 and $245
Support Levels: $112.17
Disclaimer
The views and opinions stated by the author, or any people named in this article, are for informational purposes only. They do not establish financial, investment, or other advice. Investing in or trading crypto assets comes with a risk of financial loss.



