
 Celestia
 Starknet
 Quantus
 NEAR Protocol
 Pump.fun
 Hyperliquid
 LayerZero
- JP Morgan adjusted the target price of the stock from $125 to $120.
- Walt Disney Company stock is trading near the low of 2020.
- Disney’s stock price has declined by 12% in a year.
The Disney stock price is currently in a 4-day gaining streak. It has taken good support from the $79.47 level, which is also a low for the year 2020. The stock price has reversed from this level in 2020, and the price has surged by over 150% from there. This uptrend was halted in March 2021.
The Disney stock price has melted down over 58% of its gain since March 2021. The stock has yet to change the bearish structure, as it has yet to form a higher high and higher low pattern. Rating Firm JP Morgan has cut down the target price of the stock from $125 to $120. However, it has maintained the overweight rating on the stock.
The Disney Company has reported a dull revenue and income growth over the quarters, which could be the reason for a downtrend. It has failed to control the Net debt as the net debt has increased significantly over the years. The company has paid no dividends in the last 2 years. Thus, it is not a good option for dividend-seeking investors.
The Disney share option chain is showing a bearish sentiment as of now. There is a total open interest of 5016 at the 85 strike price on the call side. It is the highest open interest on any strike price. That indicates that the stock will face some difficulty in crossing this $85 level. If we examine the open interest on the Put side, the highest OI is at $84. It will be very interesting to see who will win.
Synopsis of the Disney Stock Daily chart
DIS stock price has taken support from the $79.47 level which is marked as the Support 1 on the chart. There is a strong resistance present at the $84 level as both trendline and horizontal resistance are colliding together at this level. This is also a strong resistance point as the price breached this level in August 2023.
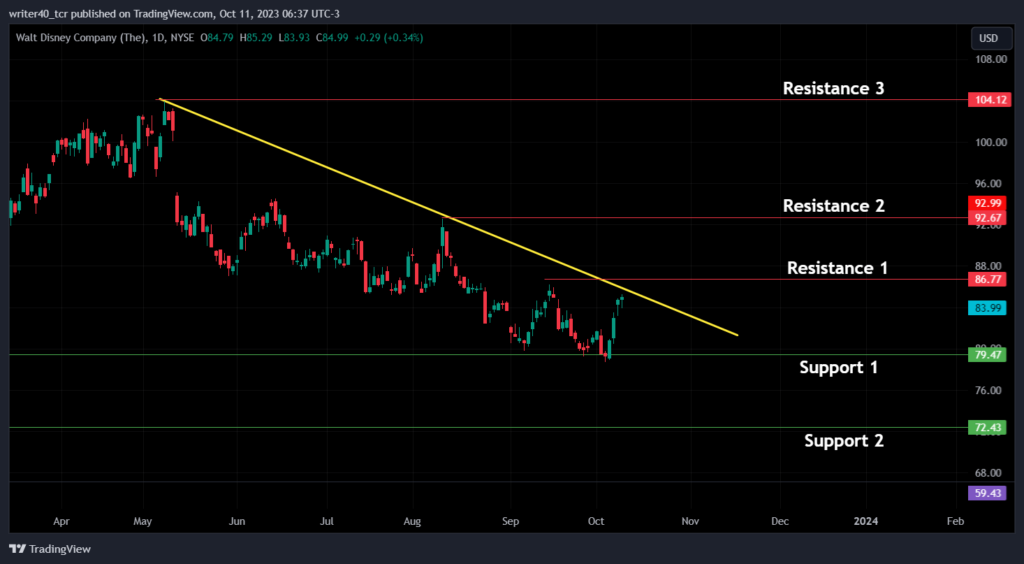
Apart from this level, the price can face rejection from the level of $92.67 and $104.12. These levels are marked as resistance 2 and resistance 3 on the chart. If we consider the support level of the stock, then it is present near the level of $72.43. The price has formed a double bottom pattern at the support, it is not easy to breach this support level.
What Indicators are saying about the Disney stock price
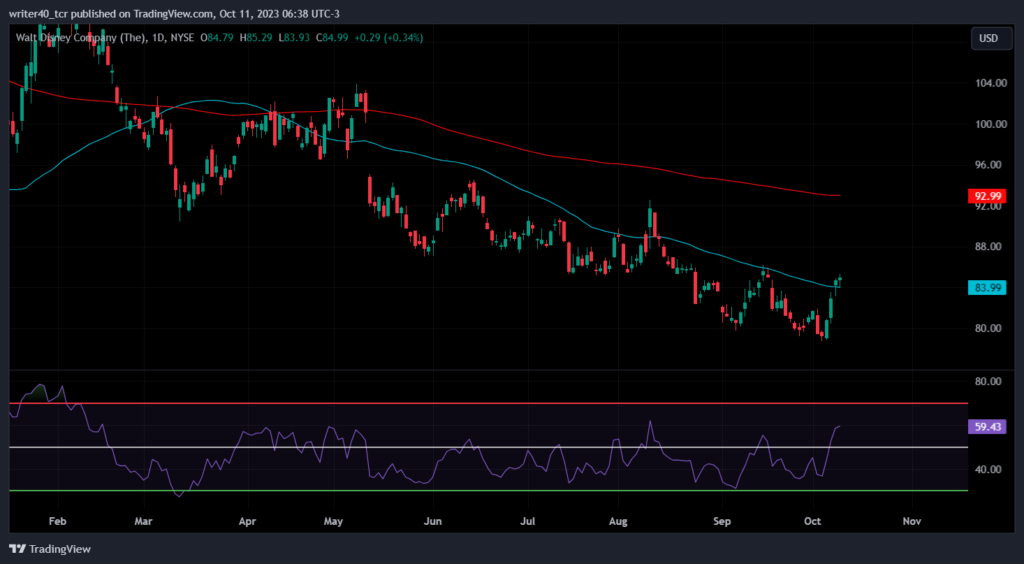
The Exponential Moving average indicator is showing bearish sentiment but the RSI shows that the buyers have gained necessary momentum.
Exponential Moving Average
Currently, the DIS stock price has started trading above the 50-day Exponential Moving Average. However, the stock price is trading below the 200-day Exponential Moving Average. It shows that the price has got the necessary momentum, but to show a strong uptrend the stock should cross the 200-day Exponential Moving Average.
Relative Strength Index
The Relative Strength Index is currently favouring the bulls as the RSI is currently placed above the 50 level. The RSI has shown a divergence with the price, which was a bullish sign.
Conclusion
The DIS stock price is at a strong resistance level of $85, according to the price action and option chain. If the price breaks this level, it can move towards the level of $92.67. If the price takes a reversal from this resistance level, it may move towards the level of $79.47 and $72.43.
Technical levels
Resistance – $85 and $92.67
Support – $79.47 and $72.43
Disclaimer
The views and opinions stated by the author, or any people named in this article, are for informational purposes only. They do not establish financial, investment, or other advice. Investing in or trading crypto assets comes with a risk of financial loss.




