
 Celestia
 Pearl
Pearl Quantus
 Zcash
Zcash Hyperliquid
 Injective
 NEAR Protocol
- SUI/USDT is down 1.68% for the day
- SUI/USDT has taken a bounce of 40% to its resistance levels of $0.71556
SUI has been following a downtrend since May. The token was listed on the exchange recently which was followed by a huge pump of around 1842.55%.
SUI/USDT is trading at $0.63716 as of today. The price is down by 69% from its all-time high price of $2.0754 and 12% from its nearest resistance of $0.71556. The price action suggests a downtrend as the market is creating low lows. This could be due to the fact that investors are booking profits from the recent pump.
The daily time frame represents a minor downtrend.
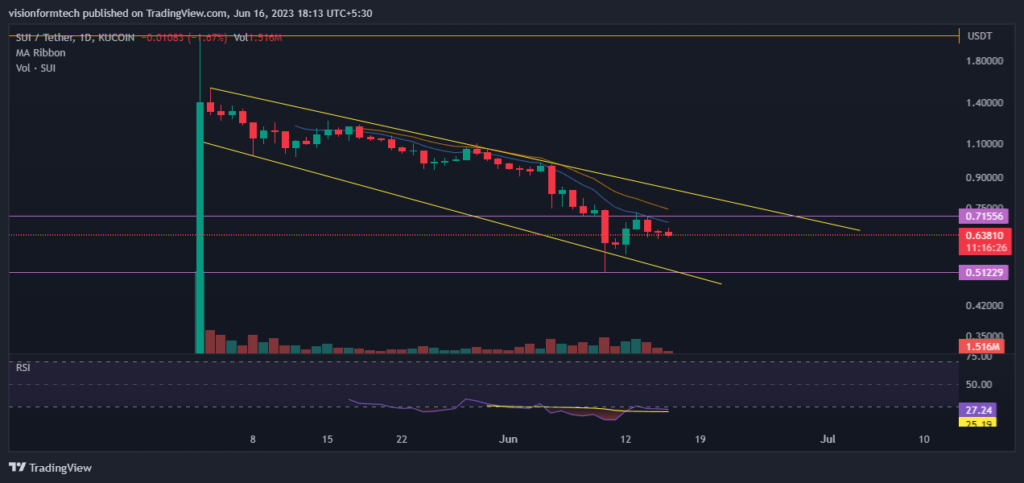
The Daily chart is showing a minor downtrend as the market structure is moving down. We can observe that the price is moving within a descending channel. It recently bounced from the level of $0.51229 which pumped the price by almost 40%. The price has taken rejection from its resistance level sending it down 12% to its current price.
The upper trendline of this downward channel should be observed closely. If the price breaks above the trendline, we can see a potential jump of at least 100%. On the downside, the only noticeable level of support is at $0.51229 which is a 20% ride down.
Due to being listed recently there is not enough data to make accurate predictions this coin.
The 4H chart displays a strong downtrend
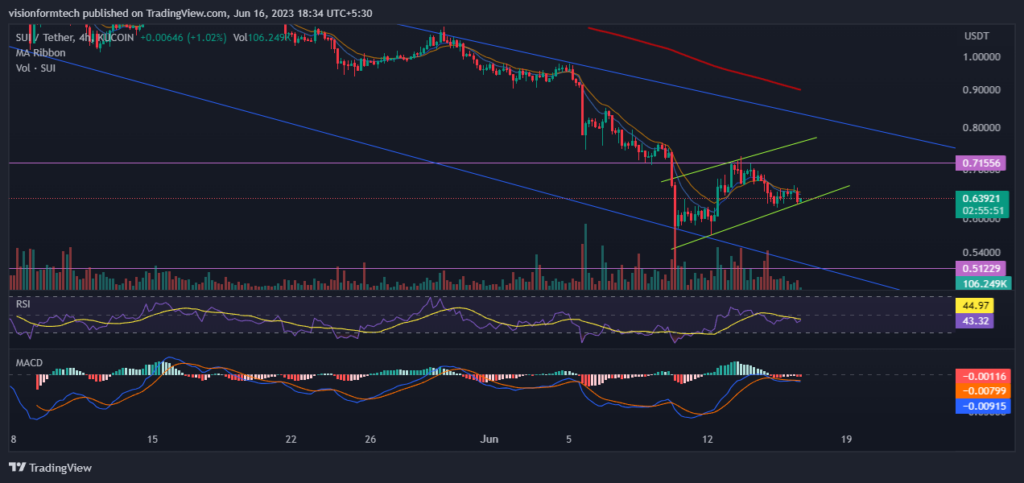
The 4H timeframe is indicating that the bears are controlling the market. The bears are selling aggressively every time the price reaches the upper trendline of this descending triangle. This is causing trouble for the bulls as the depreciating prices affect their portfolio and force them to take losses. The price action is forming a potential bear flag which is a trend continuation pattern in a downtrend. This is not a good sign for the bulls as a breakdown of this bear flag can decline the value of this asset further.
For the upside, investors must wait for a confirmed breakout above the trendline of the descending channel. Whereas bears can watch out for the breakdown of this bear flag for a potential downward move.
RSI: The RSI indicator is currently at 41.99 and the RSI has crossed the MA line towards the downside which indicates sell pressure.
MACD: The MACD indicator made a bearish crossover and this increases the probability of further downside. The MACD and Signal line is moving very close indicating a sideways momentum followed by a big move
200 EMA: As it is observed, on the 4hr, the price is trading below the 200 EMA(exponential moving average) which acts as a significant resistance. This is a clear indication of a downtrend where the sellers are in control and for a trend reversal, the price must break and trade above the 200 EMA.
Technical levels
Support Levels: $0.5122
Current Price: $0.63716
Resistance Levels: $0.71556.
Conclusion
SUI has been in a downtrend since the past couple of months. The price is falling down in a downward channel. A confirmed break above the channel is the only hope for the bulls in order to push the price high. The recent bounce gave a little hope to the investors but since this asset is highly volatile, such movement of prices is very normal. Hence, it cannot be considered as a sign of reversal on its own.
As the token is relatively new, it is difficult to predict the lower levels of the price because there is not much data on the charts. Investors must do proper fundamental research before considering any investment in this asset.
Disclaimer
This evaluation or analysis given above is only for educational and informational purposes. You should not be taken it as financial, investment, or any other trading advice. Investing and trading crypto coins comes with risk. Please consider your circumstances and risk profile before making any investment decisions.




