
 Celestia
 Pearl
Pearl Quantus
 Zcash
Zcash Hyperliquid
 Aerodrome Finance
 NEAR Protocol
- AT&T Inc.’s (NYSE: T) stock price is trading below 20, 50, and 100-day EMA levels.
- AT&T is trading at $15.12.
- AT&T’s (NYSE: T) market cap is $108.1 Billion.
AT&T (NYSE: T) Stock is a worldwide telecommunications firm with headquarters in the US. One of the biggest telecom firms in the world, it offers a variety of services such as wireless communications, internet, TV, and digital entertainment.
Multiple business segments make up AT&T’s operations. To consumers, companies, and the government, the communications section provides wireless and wireline voice and data services. HBO, Turner Broadcasting System, and Warner Bros. are all included in the WarnerMedia section of the company.
Trend Analysis
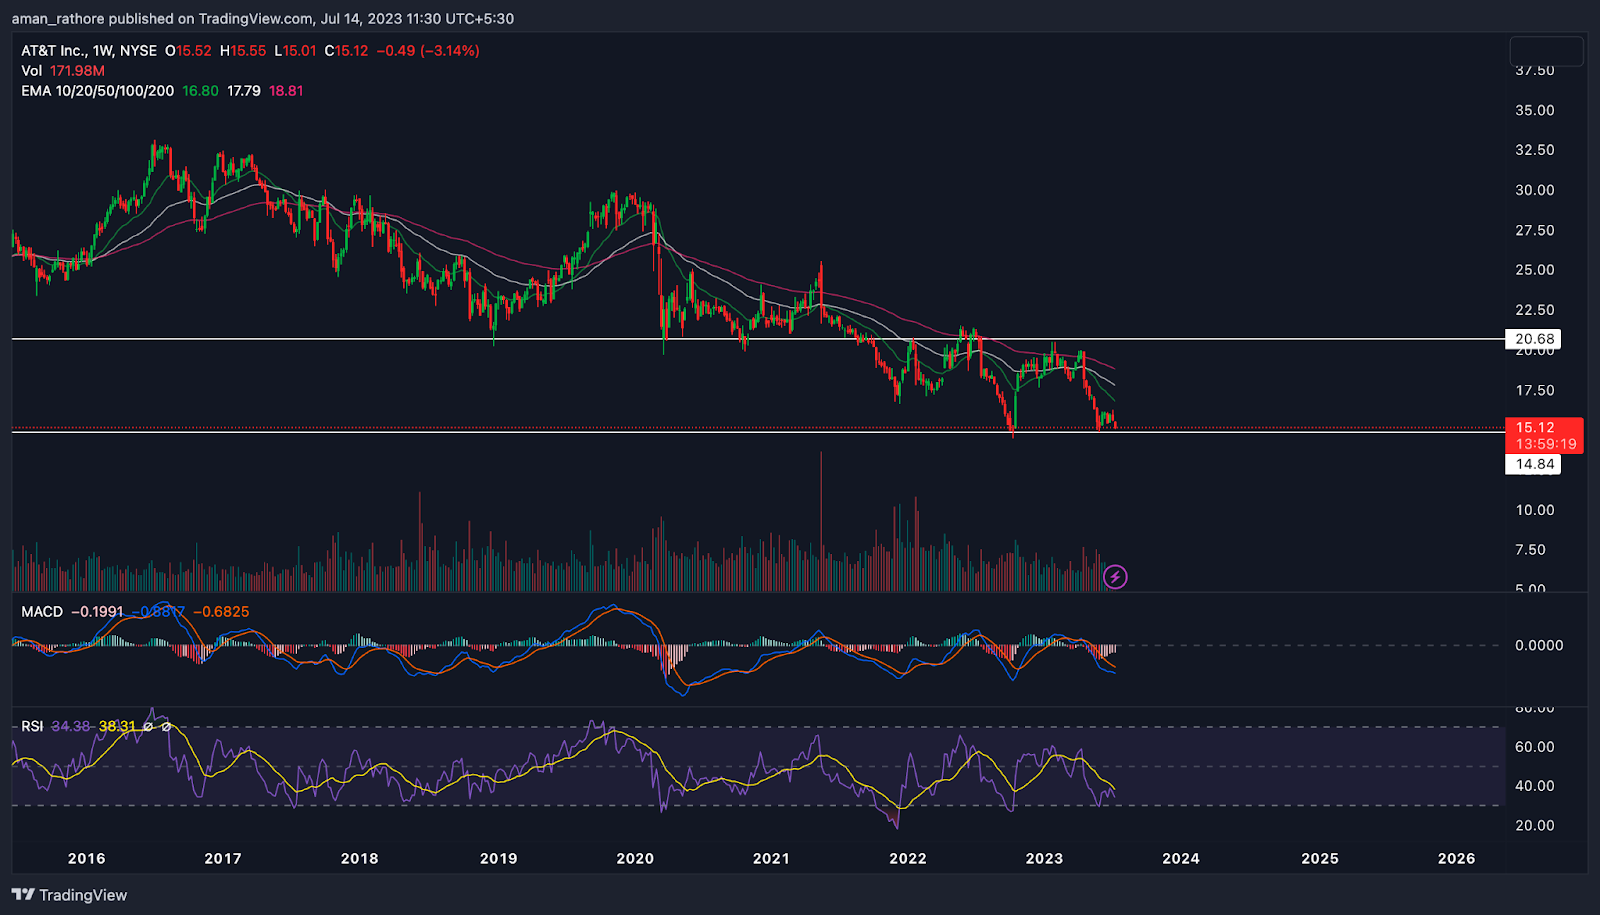
AT&T Inc.’s (NYSE: T) stock price on the weekly chart, it can be seen that the stock has been declining. The stock’s decrease since its July 2016 top of $33.16 is a 57% loss. Its lifetime low, $14.8, where it found support, was reached.
The stock price, which is close to the support level and is currently trading at $15.12, has repeatedly tried to break below it. The price breakdown below this level of support could portend the possibility of subsequent lows.
However, there may be a chance of an upward advance if the price manages to hold above the support level. The price is building a negative pattern, so it’s crucial to keep that in mind.
The AT&T Inc. price has given a fall of -26% in one year. This is a negative growth shown by the stock. The overall structure of stock seems to be forming a poor structure and yoy is also decreasing. Indicating a further fall in stock price in the future. This will lead to a decline in the buyer’s interest.
Looking at the fundamental factors, AT&T Inc. has a high amount of debt also, and its cash flow is not sufficient to pay its short-term obligations. For investors, these elements might be viewed negatively.
AT&T Inc. (T): Which Way Price Will Move?
EMA
AT&T Inc’s closing price has been trading below the moving average. The 20-day, 50-day, and 200-day EMAs are all below the closing price, and since the share price is declining, sell-side investors will start to place greater confidence in AT&T’s stock in the near term.
MACD
The MACD line for AT&T Inc. is below the signal line on a weekly basis, signaling bearish momentum. The red histogram indicates a bearish momentum. It is projected that AT&T Inc.’s price would shortly drop much further.
Volume Analysis
Charts demonstrate a consistent decline in AT&T Inc. stock volume, which is encouraging the downward trend in stock price. This dropping volume demonstrates that fewer shares of AT&T Inc. have been traded.
Conclusion
According to the analysis, the momentum of AT&T Inc is declining and the market structure is weak. The MACD, the RSI, and the EMA confirm this declining trend and suggest that the price of AT&T Inc. may continue to decline in the near future.
Technical Levels
- Support – is $15.
- Resistance – is $20.
Disclaimer
The views and opinions of the author, or anyone named in this article, are for informational purposes only. They do not offer financial, investment, or other advice. Investing or trading crypto assets involves the risk of financial loss.




