
 Celestia
 Quantus
 Starknet
 Pearl
Pearl LayerZero
 Lighter
 Bitcoin
- ASOS is currently trading at $427.0.
- ASOS is up by 3.05% in the last 24 hours.
The ASOS PLC was founded by Nicholas Jon Robertson and Quentin John Griffiths on June 2, 2000. The firms offer clothes and other fashion items available in retail. It deals with the operation of multi-platform offering fashion products.
On July 25, 2023, ASOS Plc announced that the Frasers Group has increased its stakes in the company. They said that the Frasers Group has raised their stakes from 13.33% to 15.12%. ASOS Plc also added that Fraser’s voting rights in the group are now composed of 10.58% attached to shares and 4.54% through the financial instrument.
ASOS Price Still in Bullish momentum?
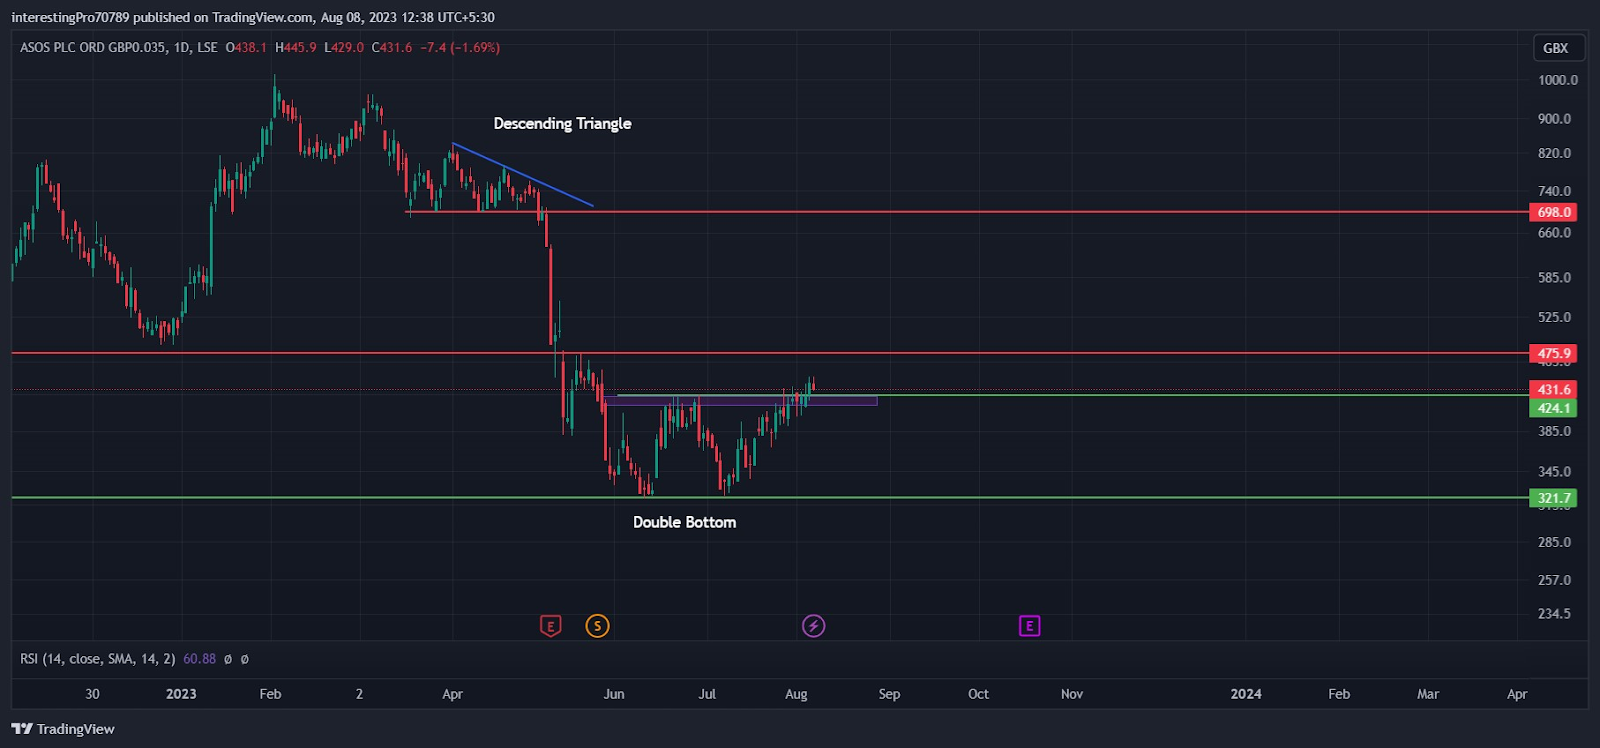
In March 2023, ASOS Stock price started to form a bearish pattern, descending triangle, and started to fall to the $319.7 support level. It showed a bullish rally every time the price came to that support level. The ASOS Stock price formed a double bottom at the support, which is also seen as a strong bullish reversal pattern.
Recently, the price gave a breakout of the double bottom pattern in the daily as well as weekly time frame chart of ASOS. Currently, the price is sustaining over the neckline of double bottom and $424.1.
If the price sustains over the $424.1 level, then the price can be seen till the $475.9 resistance level, and if the price breaks the $475.9 resistance and sustains over it then the next resistance is at $698. Furthermore, if the price is not able to sustain over the $424.1 level then we can see the price again on its support level of $321.7.
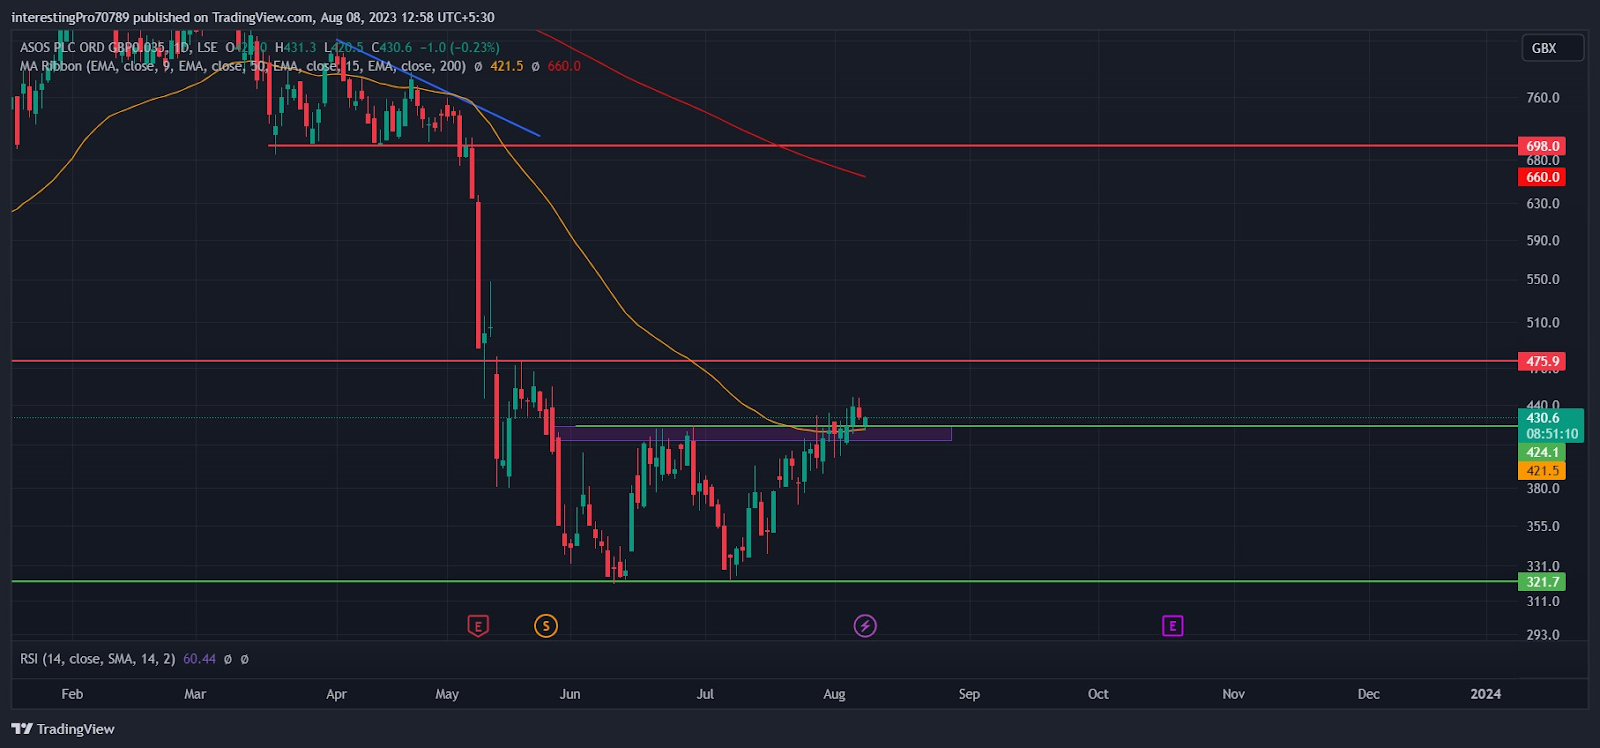
The 50 EMA (yellow line) is at $421.2 and the 200 EMA (red line) is at $662.4. The ASOS price is currently trading above the 50 EMA and below the 200 EMA, which shows the indecisive nature of the price.
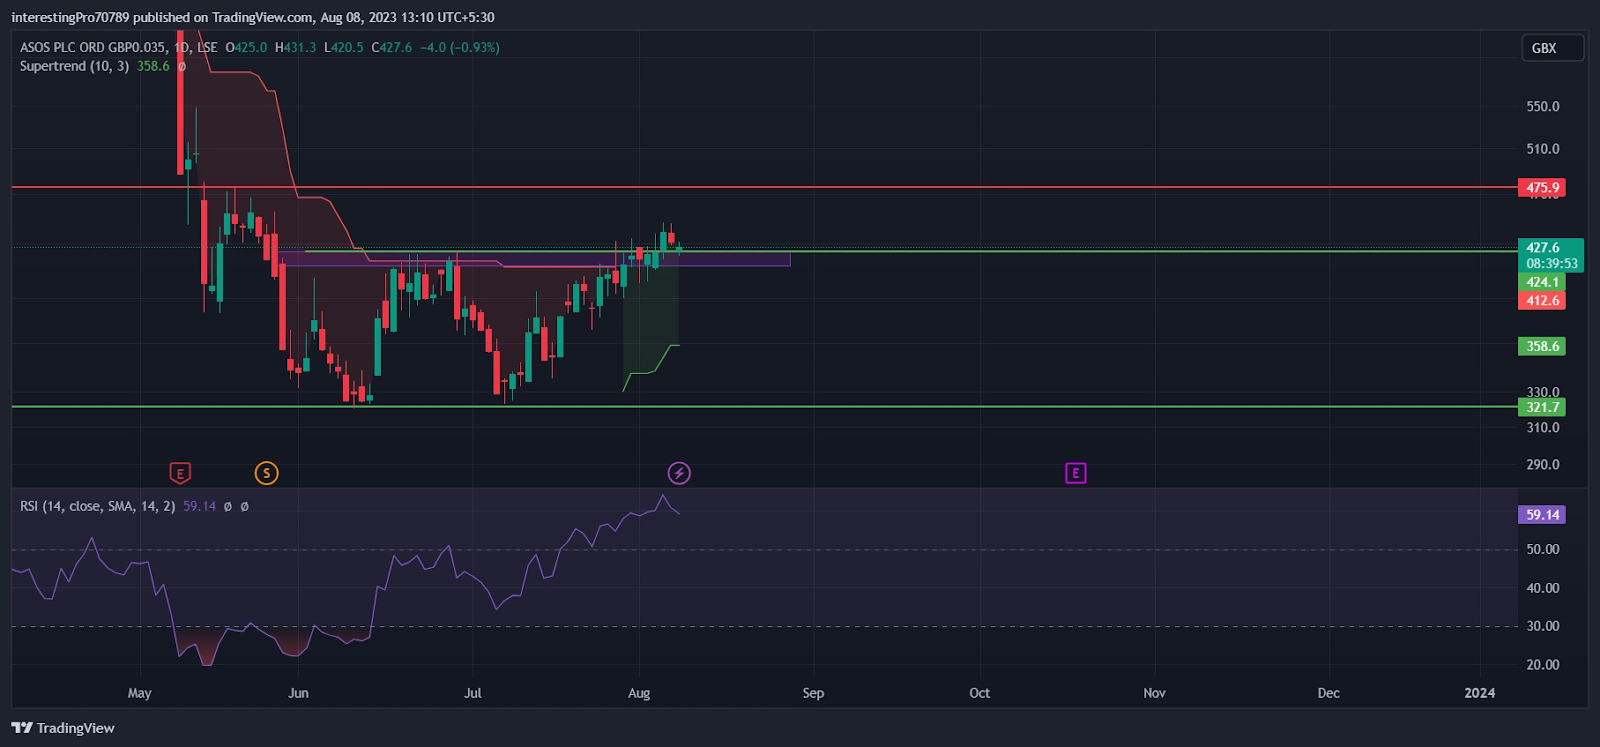
The relative strength index (RSI) was seen trending in an upward direction since July 2023 in which the RSI line was at 38. Currently, the RSI is at 59, which indicates the bullish sentiment and buyer’s control in the ASOS chart as of right now, but the RSI line is trending in a downward direction. If the RSI takes support from the 50 percent RSI level, then again the bullish sentiment can be seen.
The Super Trend indicates the bullish sentiment and control of buyers in the ASOS chart for now, as the price is trading above the green line. If the price closes below the green line, then the presence of sellers can be seen in the ASOS chart.
Conclusion
Overall, the ASOS stock price chart is bullish. The stock is in a bullish momentum and is likely to continue its bullish momentum and show a rise in price in future. All the indicators mentioned above are in a bullish or neutral state as of right now. However, the RSI is trending in an upward direction from July and is heading towards the overbought territory, which could lead to a pullback in the short term.
Technical levels
Resistance levels: $475.9 and $698
Support levels: $424.1 and $321.7
Disclaimer
The views and opinions stated by the author, or any people named in this article, are for informational purposes only. They do not establish financial, investment, or other advice. Investing in or trading crypto assets comes with a risk of financial loss.




