
 Dacity Coin
 Injective
 Pump.fun
 Pearl
Pearl Starknet
 Quantus
 NEAR Protocol
- BRBY stock price is currently trading at 2204 GBX.
- The price is currently sustaining below a major resistance of 2254 GBX.
Burberry Group Plc was founded by Thomas Burberry in 1856. The company operates as a holding company that manufactures, designs, and distributes apparel and accessories under the Burberry brand.
On August 10, securities analysts revised their ratings and price targets on several companies, and Burberry was among them. The revised target on BRBY was raise from 2267p to 2333p.
Burberry Group Plc (BRBY): Financial Analysis
The Burberry financial report has shown great growth in the last 3 years in the revenue report from 2020 to 2022, with an overall growth of 0.32%. The company was able to consecutively beat the previous three estimated figures on the revenue report.
BRBY’s Revenue report for 2023 is estimate to have a growth rate of 0.05%. The company’s revenue growth has shown stable growth in the last three years, which shows that the company is capable of meeting the estimated revenue in 2023.
The Burberry company was able to give above the 40-plus dividend payout ratio over the last three years.
Burberry Group Plc (BRBY): Technical Analysis
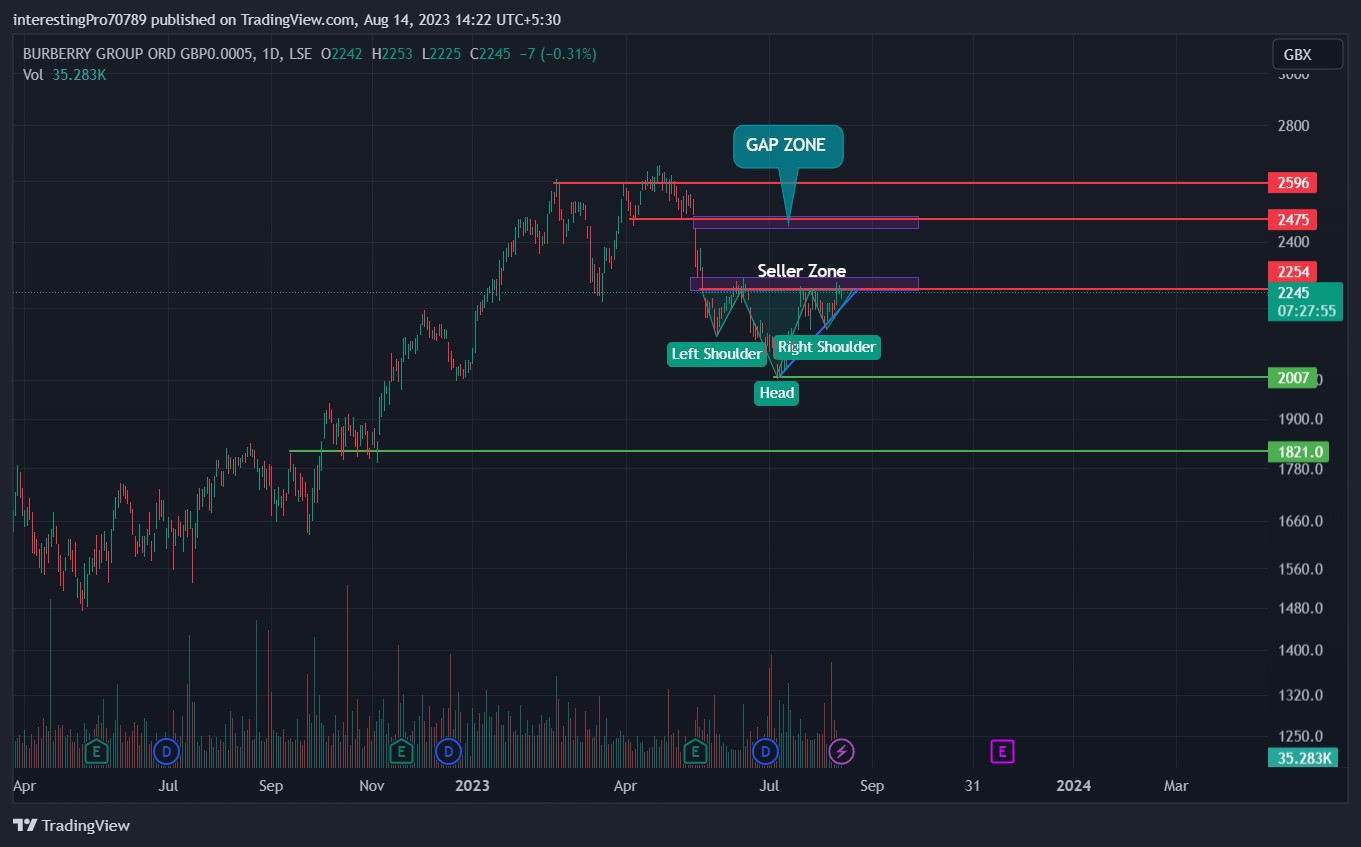
Currently, the BRBY stock price is trading at 2245 GBX with an average volume of 1.329 million and a market capitalization of 8.425 billion.
In April 2023, Burberry Stock price was seen closing above the 2596 GBX resistance after a long uptrend move, but couldn’t sustain it and face rejection from there. The price started falling until the 2007 GBX support level and was forming a higher low structure in the market while falling.
In July 2023, Burberry Stock price formed a support at 2007 GBX and started a bullish rally until 2254 GBX resistance, and currently, the price is trading below that resistance. If we see the chart of Burberry, we can see that the price has been in an uptrend since last year, and between January 2023 and May 2023, the price formed a double top pattern, which is a bearish reversal pattern at the 2596 GBX, and started falling.
In the short term, we can see that price is making an inverted head and shoulder pattern. So if Burberry Stock price gives the breakout of the 2254 GBX or the neckline of the inverted head and shoulder, the price could move up to fill the gap that was left by the market. If we apply the Fib retracement from 2596 GBX to 2007 GBX. The golden level of Fib is at the gap that is left by the market. So the chances of the price moving up in the short term are high.
And if the price faces rejection from the 2254 GBX resistance level, then the price could be seen continuing its downtrend.
Technical Indicators And Predictions About The Current Trend
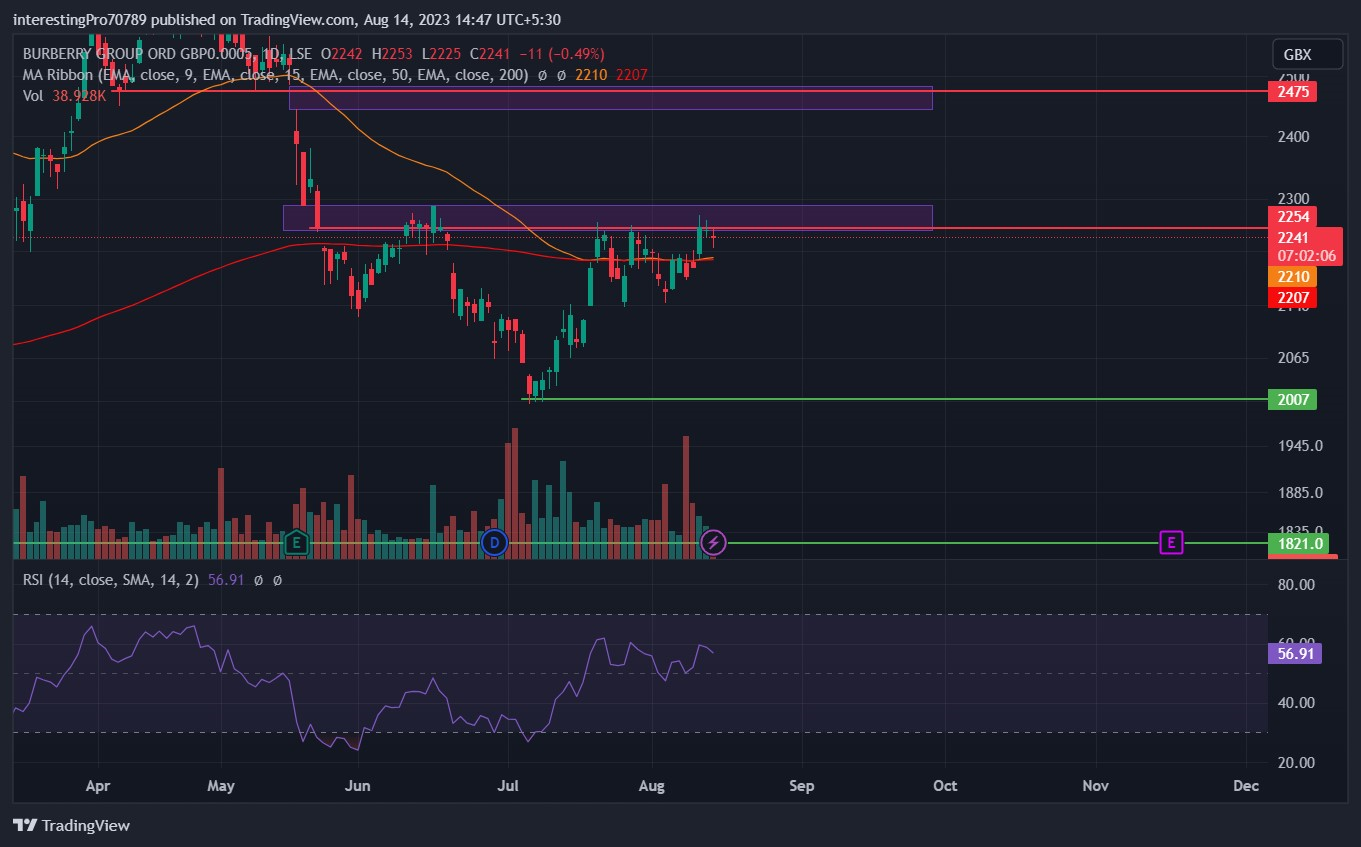
The 50 EMA (yellow line) is at 2210 GBX, and the 200 EMA (red line) is at 2207 GBX. Burberry Stock price is currently above the 50 and 200 EMAs. Which indicates that the price is in bullish sentiment and the buyers have control of the current scenario.
The Relative Strength Index (RSI) is at 57.56. Which means the price is in neutral territory, taking pressure from buyers as well as sellers.
Conclusion
The chart of BRBY will be bullish in the short term if only Burberry Stock price closes above 2254 GBX. Then the price could be seen at 2475 GBX resistance. But if the price faces rejection from 2254 GBX, the price could be seen continuing its downtrend. But for the price to continue its uptrend in the long term, it should close above the 2475 GBX and have to sustain it. All the indicators mentioned above are bullish or neutral as of right now.
Technical levels
Resistance levels: 2254 GBx and 2475 GBX
Support levels: 2007 GBX
Disclaimer
The views and opinions stated by the author or any other person named in this article, are for informational purposes only. They do not provide financial, investment, or other advice. Investing in or trading crypto assets comes with a risk of financial loss.




