
 Zcash
Zcash Sui
Sui Celestia
 Quantus
 Injective
 Hyperliquid
 LayerZero
- AFC Stock is currently trading at $16.68.
- The company chart shows a breakout of the channel it was trading in.
AFC Energy was founded in January 2006 by Howard White. The company deals in the development of fuel cells. The company focuses on installing, owning, operating, and maintaining stationary alkaline systems that generate durable power and fuel efficiency for the future.
On July 28, 2023, AFC Energy entered into a deal with Speedy Hire to provide a path to market for an AIM-listed hydrogen-powered generator company. They also added that “They believed to maintain their buy recommendation and 125 pence price target on AFC shares, which gained 11% to 16p.
AFC Energy Stock: Technical Analysis
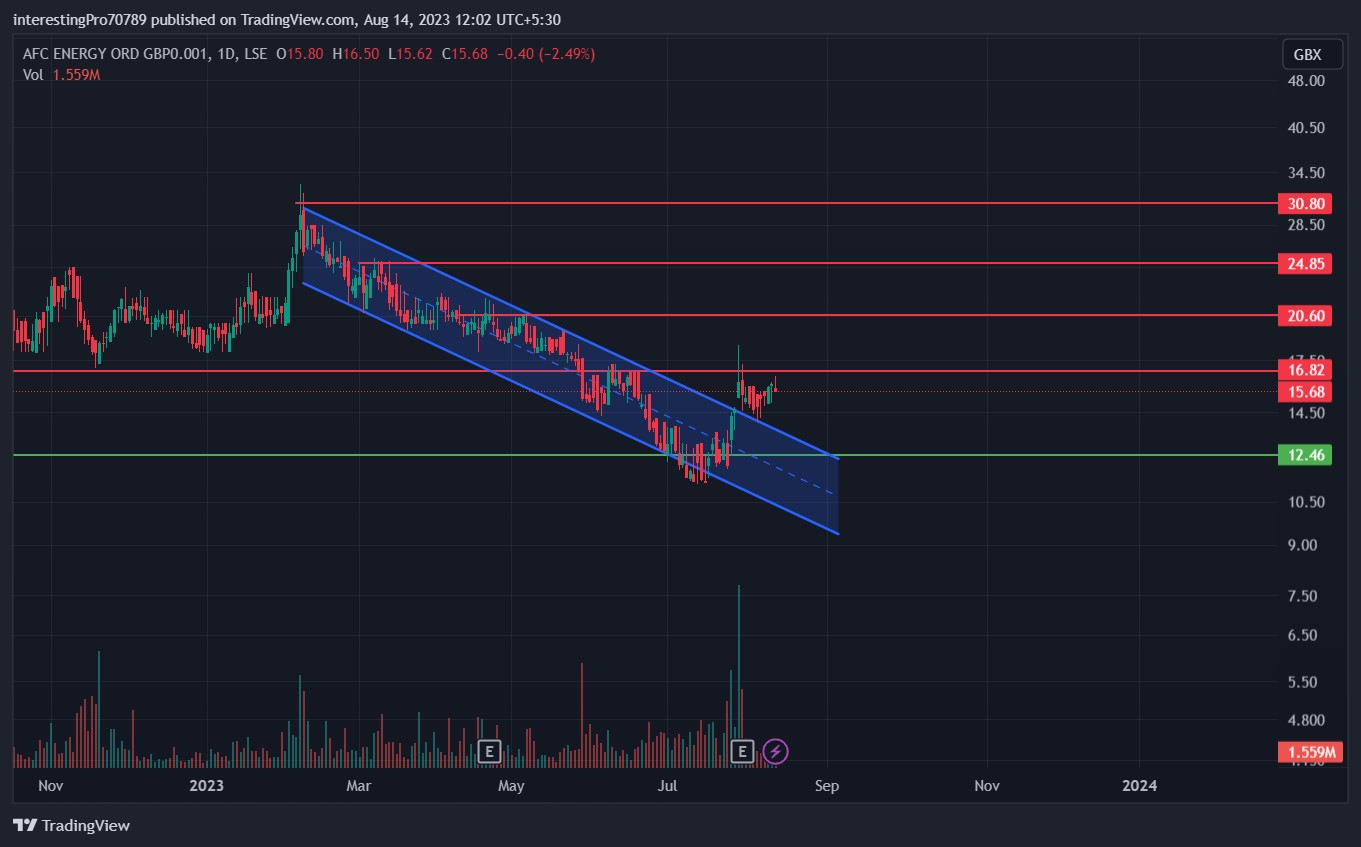
Currently, the AFC Energy stock price is trading at $15.68, with an average volume of 2.226 million and a market capitalization of 117.01 million.
In February 2023. The AFC stock price faced rejection from the $30.80 level. and the price was seen falling from there. And then the price was seen to be stuck inside a falling channel. And the price was falling within that channel for 6 months.
In July 2023 the price was seen reaching its $12.46 support. After a few days, the price of AFC Energy stock showed a breakdown of that support level and the breakdown of the falling channel as well. But the price got back inside the support level of $12.46 and the channel pattern, which turned the breakdown into a fakeout.
In the same month, July 2023. The price was seen breaking out of the falling channel and currently sustaining below the $16.82 resistance level. If we look at the chart of AFC. We can also see the price making an inverted head and shoulder pattern, which is also a bullish pattern.
So if the price closes above or can give a breakout of the $16.82 resistance level and sustain over it. Then bullish momentum is expect in the price. But if the price faced rejection from the resistance of $16.82. Then the phttps://themarketperiodical.com/2023/08/15/litecoin-price-prediction-ltc-preparing-for-a-trending-move/rice can be seen in the range of $16.82 to $12.46.
Technical Indicators And Predictions About The Current Trend
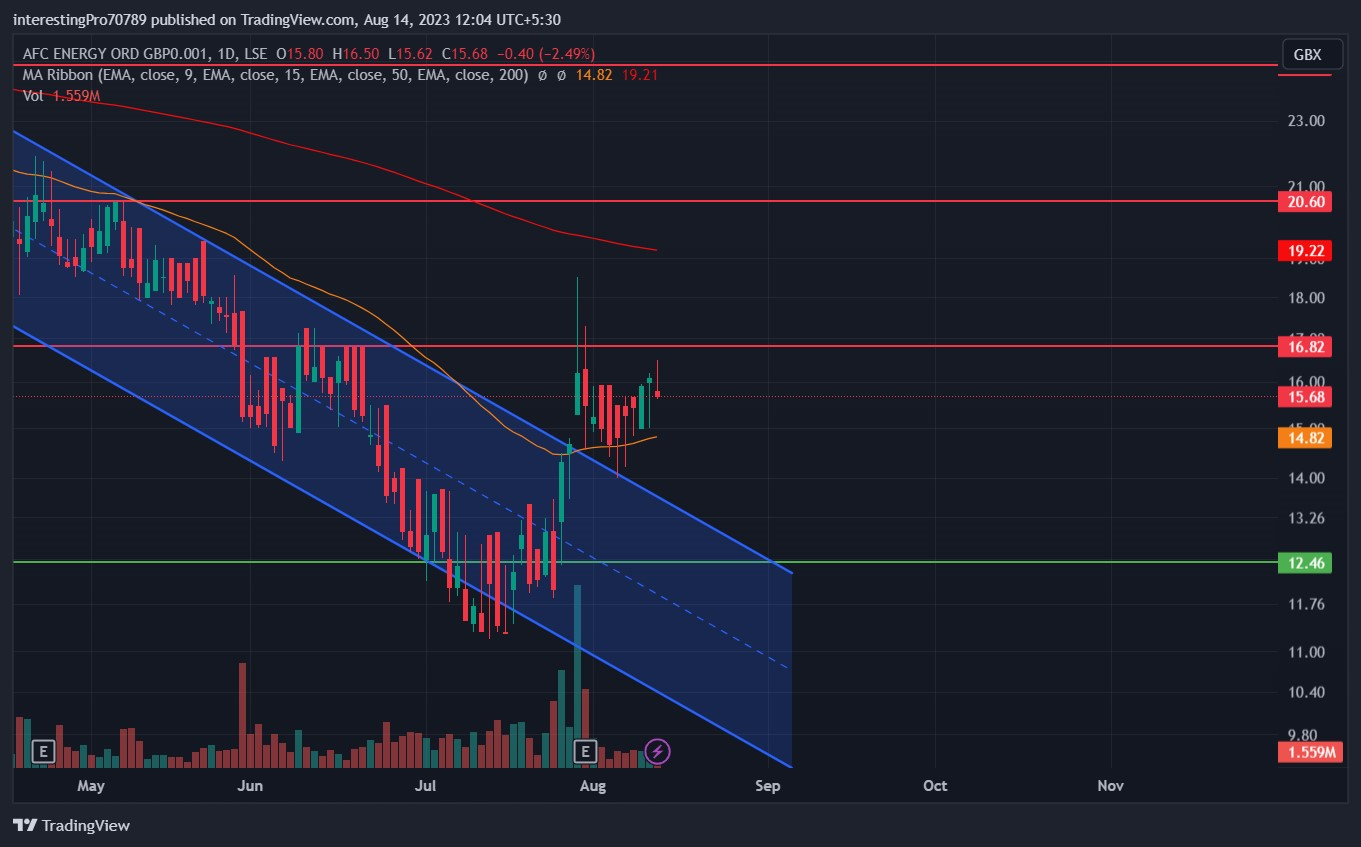
The 50 EMA (yellow line) is at $14.82, and the 200 EMA (red line) is at $19.22. The price is currently trading above the 50 EMA, which is indicating that the price is in bullish sentiment. But the price is also trading below the 200 EMA, which is indicating bearish sentiment in the chart. This shows that the price is currently indecisive.
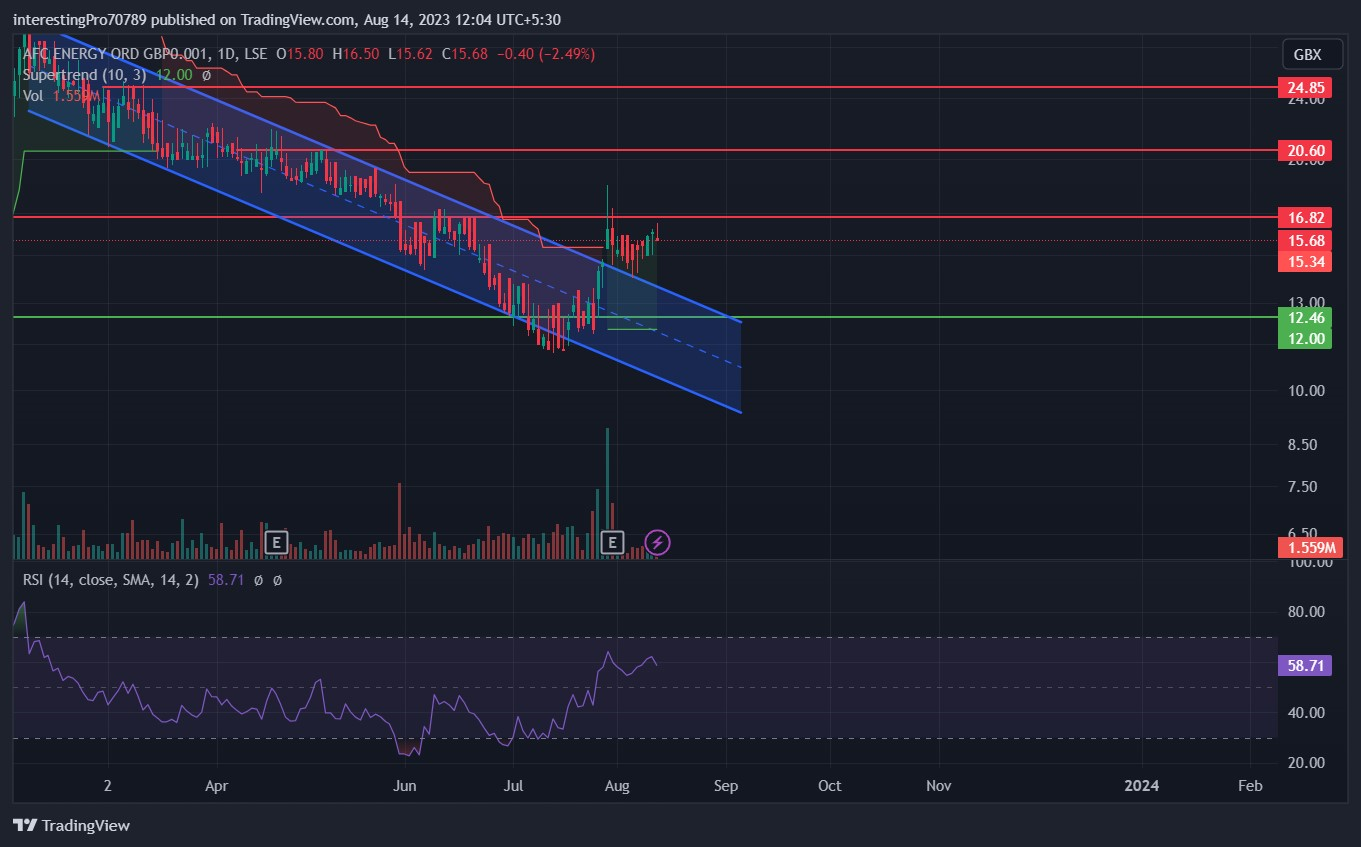
The Relative Strength Index (RSI) is at 58.71, which shows the price is in bullish sentiment and the buyer still has the strength to make the price move in an upward direction.
The Super-Trend shows that the price is still in bullish sentiment as the price is still above the green line. If only the price closes below the green line, then only a bearish sentiment can be seen in the AFC chart.
Conclusion
The AFC chart is bullish in the current scenario, as we can see from AFC Energy Stock price breakdown that trapped every seller. And recently, it has also given a breakout of the falling channel and formed an Inverted Head and Shoulder pattern. If price closes above the $16.82 resistance, then a bullish move is expect until its resistance at $20.60 and $24.85. But the price failed to close above the $16.82 resistance. And the price can be seen in the range of $16.82 to 12.46. All the indicators mentioned above are bullish, and only the EMA is indecisive right now.
Technical levels
Resistance levels: $16.82, $20.60 and $24.85.
Support levels: $12.46.
Disclaimer
The views and opinions stated by the author or any other person named in this article, are for informational purposes only. They do not provide financial, investment, or other advice. Investing in or trading crypto assets comes with a risk of financial loss.




