
 Celestia
 Pearl
Pearl Quantus
 Zcash
Zcash Hyperliquid
 Injective
 NEAR Protocol
- The stock price of DNLM has been consistently consolidating within a range define by its immediate support and resistance levels.
- The price took support from the 50-day EMA to rise further, but got push down at its resistance level once again.
- MACD and RSI have given a sell signal, while the stock bounced back from its 200 EMA.
After rising from £698 in September 2022 to £1297 in March 2023, equivalent to a growth of 85%, the DNLM stock entered into a consolidation phase in March. However, DNLM stock was seen taking support from its 200 EMA in April and June. Since the stock price has been in a steep consolidation zone between £1,189 and £1,045, its EMAs are also sideways, providing no benefit to bullish investors.
One of the reasons why DNLM stock price hasn’t fallen even after all the pressure from bears is because it has been reflecting constant revenue growth in its recent half-yearly reports. Furthermore, the company has also been net profit positive in all these years, giving attractive dividend yields of 7% on average.
Technical Analysis of DNLM Stock
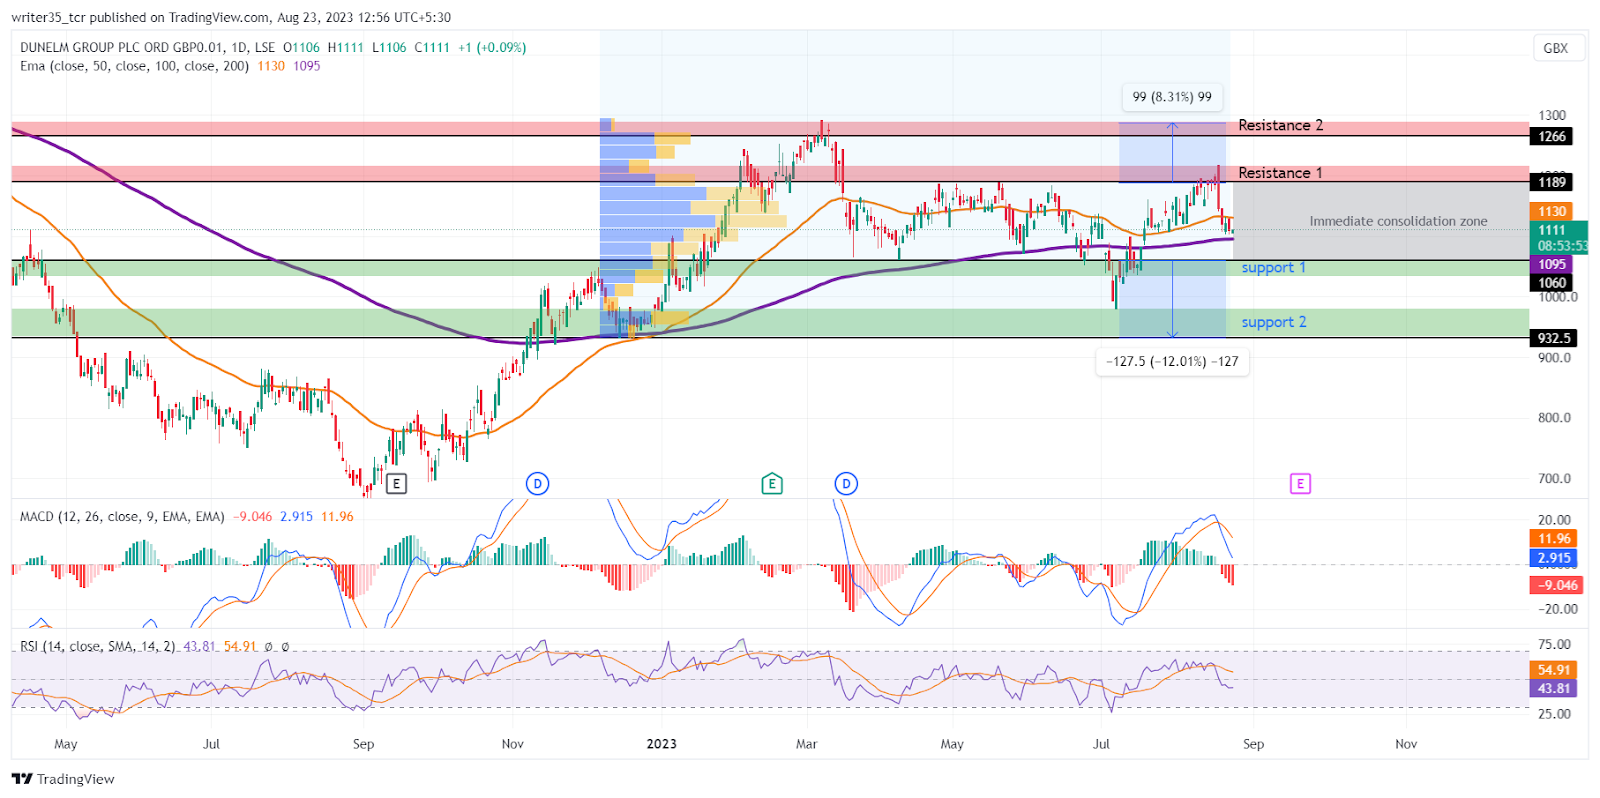
At the time of writing, DNLM stock is seen fluctuating within the same consolidation zone, and the graph looks like a ring tussle from March of this year. However, the indicators have recently been providing some valuable insights.
What Are The Indicators Saying?
The MACD graph is showing a recent bullish crossover between the MACD line and its EMA on the 17th of August of this year, and this was after the price bounce off from its immediate resistance level of £1,189.
Currently, both the lines in the MACD graph are seen to be falling towards their neutral level of zero, with the EMA at 11.9 and the MACD line at 2.62
The RSI graph is painting a similar picture to the MACD, after the bounce off from resistance. The RSI fell from a ‘fairly bought’ level of 61 to 43, which is a little below its neutral territory. The SMA of RSI is above 54, indicating a weak strength in the price.
The price took support from its 50 EMA back in July of this year in the hopes of finally breaking through its resistance level of £1,189, but such bullish hopes were shatter after bears rejected the bullish rally again.
Currently, DNLM stock price is between its 50 EMA of £1,130 and the 200 EMA of £1,095. While the immediate support is at the level of £1,060. This level is further followed by a 2nd support of £932. On the other hand, the first and the second resistance levels are at £1,189 and £1,226, respectively.
Conclusion
The DNLM stock price analysis is indicating a consolidation. Until the stock breaks out of its immediate support and resistance levels.
A gradual uptrend is evident in the daily time frame, with the bulls finding support around the 200 EMA levels. A potential bullish scenario might emerge if the price manages to surpass both its 50 EMA and immediate resistance. In such a case, traders could consider initiating a buying position. While also placing a stop loss above the region corresponding to the second support level.
Technical levels
Support: £1,060, £932
Resistance: £1,289, £1,266
Disclaimer
The views and opinions stated by the author, or any people named in this article, are for informational purposes only. They do not establish financial, investment, or other advice. Investing in or trading crypto assets comes with a risk of financial loss.




