
 Dacity Coin
 Quantus
 Hyperliquid
 Bitcoin
 Lighter
 Uniswap
 NEAR Protocol
- PacWest Bancorp. price has decreased by -65% in YTD.
- PacWest Bancorp. stock has a share float of 472.7 Million.
- PACW live market cap is $116.1 Million.
PacWest Bancorp. is a bank holdings company. It provides financial and banking solutions. PACW was founded in 1999 with its headquarters is in California.
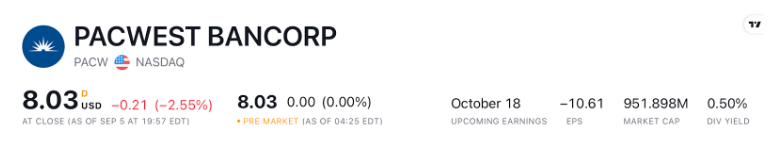
PacWest Bancorp. (PACW) stock is trading in a downward momentum. The price of PACW is forming a lower-high pattern. The price of PACW stock is creating a strong bearish pattern.
Financial Data of PacWest Bancorp. (NASDAQ: PACW)
The current EPS of PacWest Bancorp Inc. (PACW) is -$10.61 per share. The revenue of the stock is $1.64 Billion. The market capital of PACW is $951.8 Million. Currently, the stock is trading at $8.03, with a decline of -2.55% on 6 September 2023.
The PACW price has shown a decline of almost -10% in the last month.
The Pacwest has a 24-hour trading volume of $1.8 Million. The Q2 2023 revenue of the PACW is $409 Million. The year-over-year change in revenue of the PACW has decreased by 8.1%.
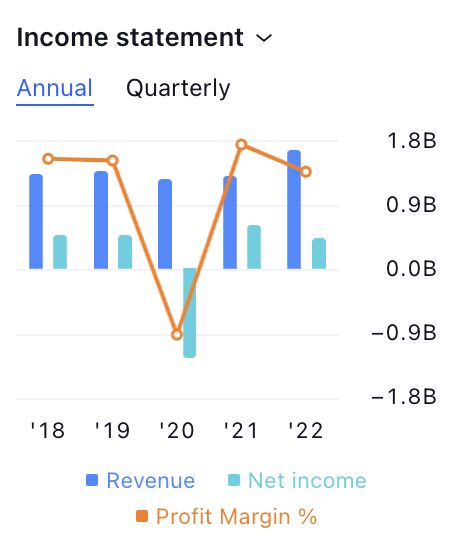
As per the income statement, the quarterly profit margin % of PacWest Bancorp is decreasing along with the revenue. As seen in the chart, the orange line which represents the profit margin is declining for the year 2022. This is a weak signal.
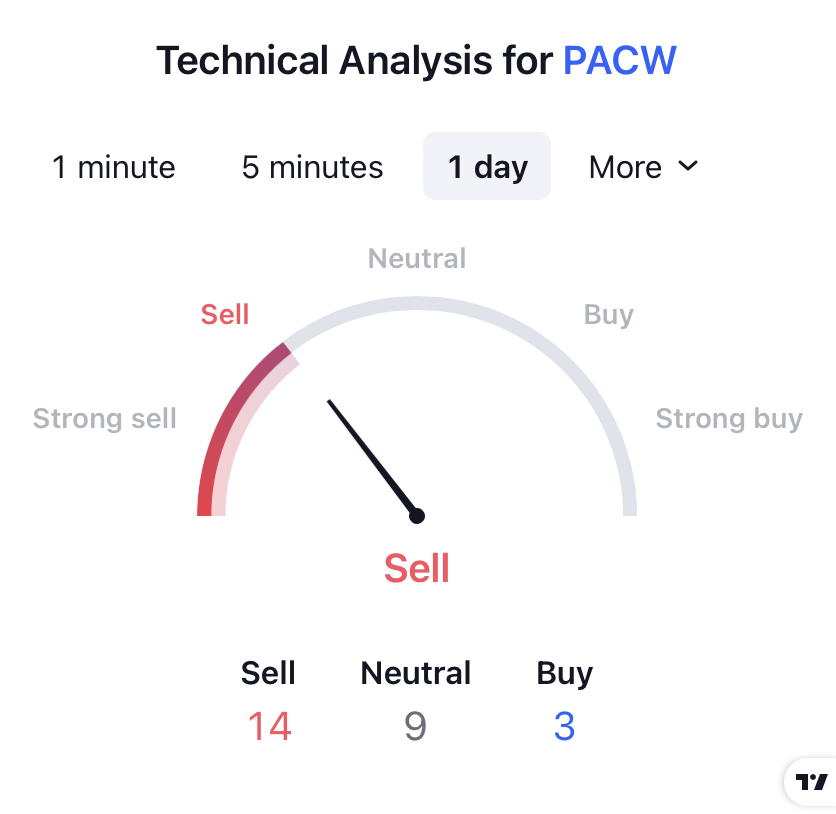
As per the technical summary tool, the PacWest Bancorp stock is indicating a sign of bearish momentum. Out of the total 26 indicators, 14 are giving a selling signal in a daily timeframe. This is a weak sign and the chances of further fall is higher.
The dividend payout ratio of the PacWest Bancorp. stock is -7.16%. The figures are negative. A dividend payout ratio of -7.1% indicates that the company is paying more dividends than its net income.
PacWest Bancorp. (PACW) Technical Analysis
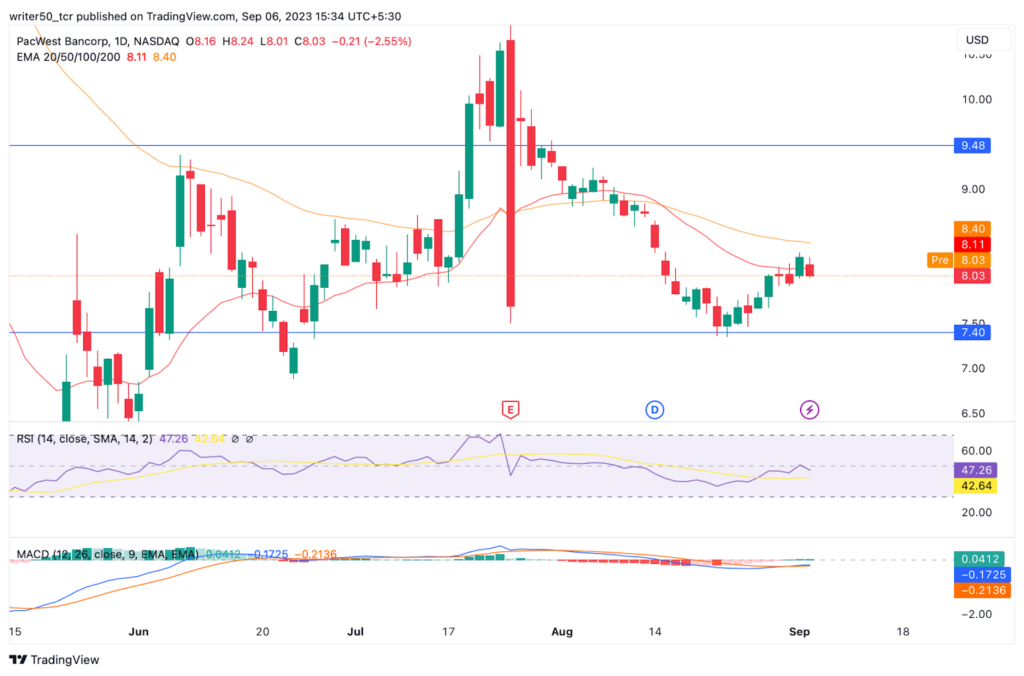
The stock price of PACW is currently trading below the 50-day and 100-day EMA levels. This is a negative sign. There is high probability for the price to fall in the upcoming days.
The MACD line is trading at -0.2 and the signal line is at -0.1. This shows that the MACD line is below the signal line. This is a negative signal. Thus, the price is likely to see new lows.
The RSI line is currently falling. RSI lines are heading towards an overbought region. This means RSI is negative and showing weak signals.
Conclusion
PacWest Bancorp. (PACW) is moving in a downward momentum. The indicators are weak on the stock price. The probability for the price to fall in the future is higher.
Technical Levels
- Support Level: $7.4
- Resistance Level: $9.4
Disclaimer
The views and opinions of the author, or anyone named in this article, are for informational purposes only. They do not offer financial, investment, or other advice. Investing or trading crypto assets involves the risk of financial loss.




