
 Zcash
Zcash Sui
Sui Celestia
 Quantus
 Injective
 Hyperliquid
 LayerZero
- Standard Chartered stock price has surged 3.63% in a week, 2.65% in a month, and 21.88% in a year.
- The STAN stock price is trading above both the 50 and 100 Exponential Moving Averages.
- Revenue and Net income have surged by over 46.80% and 48.42% respectively in the last result.
Market Capital Of Standard Chartered – $20.05 Billion
The current market price of Standard Chartered- $743.0
Standard Charted Stock Overview
In the last trading session, the stock price was up by 5.8 (0.79%). The price is trading very close to its 52-week high level of $794.4. It has recovered over 29% from its 52-week low, which indicates that the price is currently in a strong bullish trend. It has also recovered from the recent sell-off and got support from the EMA.
The stock price has been facing this resistance since 2017 and has not been able to cross the level yet. The financials of the company witnessed some pressure on revenue and net income for 3-4 years. It resulted in a consolidation of this stock. The stock has generated a good profit in the last result.
The revenue of the company has surged by 46.80% in the last result, which has declined for two consecutive years i.e. 2020 and 2021 respectively. The Net income of the company has surged by 357% and 48.42% in the previous two years. It is a sign of good financial growth for the company.
The Net debt of the company has risen for 3 years, which is not a good sign for any company’s growth. Although the Net debt has been reduced if we compare it with the net debt of 2016 and 2017. The dividend yield of the company has been rising for 4 years. It shows that the company is a good investment for dividend-seeking investors.
Technical Analysis of Standard Chartered Stock
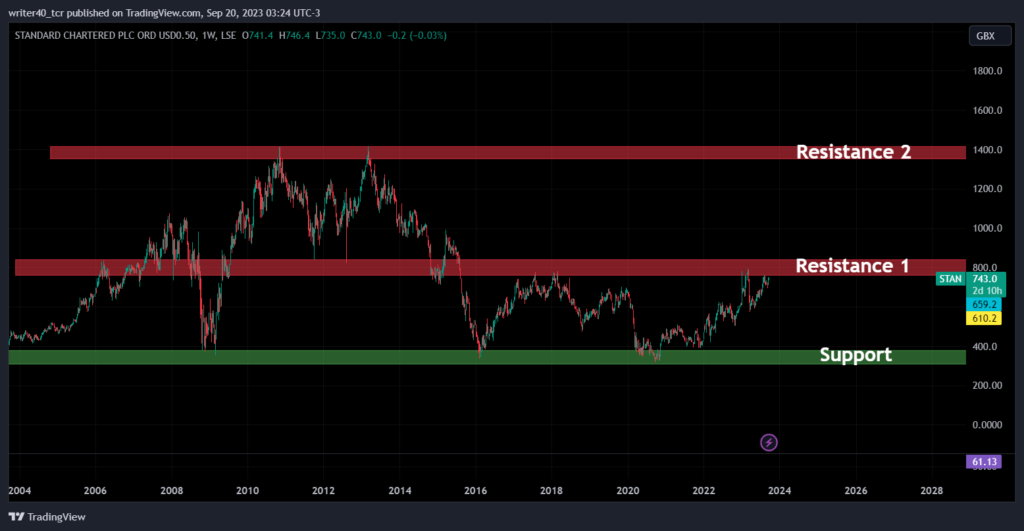
On a weekly time frame, the price is currently trading very close to the resistance area which has not yet been breached in 5 years. However, now the price is looking super strong this time. It is currently attempting to breach the levels as the financials have shown good growth. It boosts the confidence of the buyers.
The resistance is currently falling near the level of $760 and $800, which is very close to the current market price of the stock. The next import resistance area is present near the level of $1400, which is also an all-time high level. The support for the price on a weekly time frame is present between the level of $335 and $315.
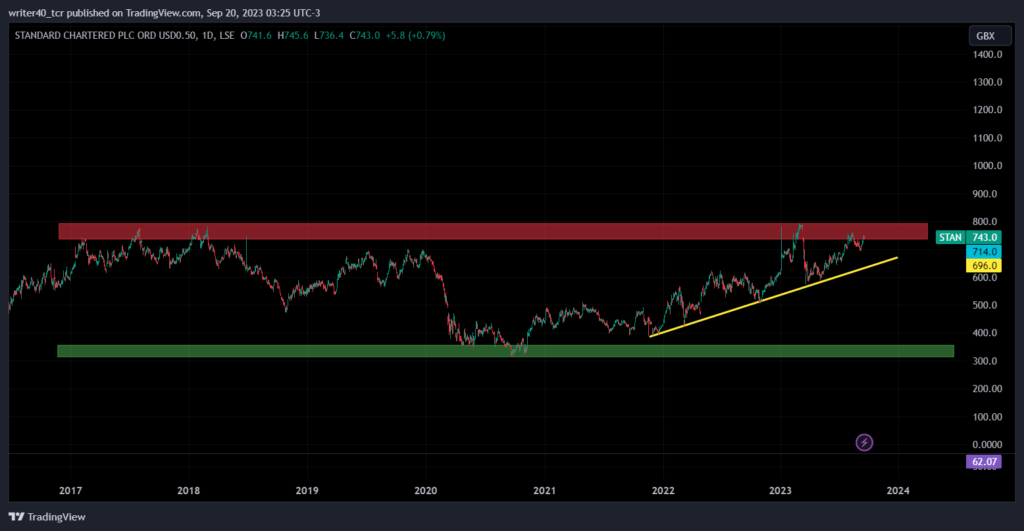
On a daily time frame, the price has formed a rising trendline support. It is currently present near the level of $640 and the slope of the trendline is close to 30 degrees. It is not very flat nor steep indicating that the trendline is very reliable for the support. The resistance for the stock is the same as it was on the weekly chart i.e. between $740 and $800 levels.
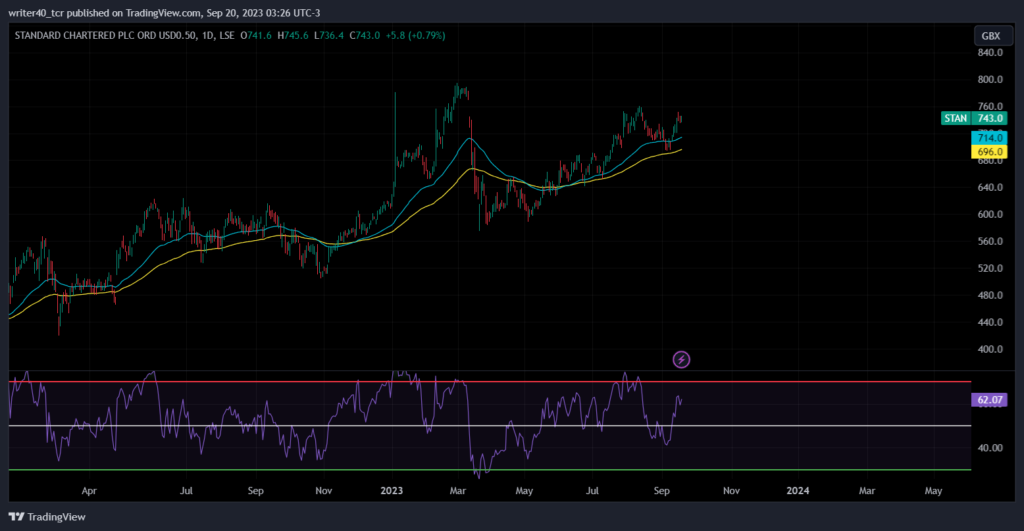
The stock is currently trading above 50 and 100 EMAs, which is a bullish sign. It has beautifully recovered from the 50 and 100 EMAs, which shows that the price is bullish and respecting the technical levels. The relative Strength Index is also near 62.07 which indicates a strong bullish momentum is going in this stock.
Conclusion
The Standard Chartered company has significantly improved its financial tally which can provide the necessary boost to the stock as the stock is trading very close to the multi-year resistance level. The price action along with the Indicators is showing a sign of bullishness in this stock which can be continued ahead.
If the price can break the resistance level this time then the stock can witness a strong upward rally towards the level of $1000, $1200, and eventually $1400.
Technical Level
Resistance – $750 and $800
Support- $700 and $640
Disclaimer
The views and opinions stated by the author, or any people named in this article, are for informational purposes only. They do not establish financial, investment, or other advice. Investing in or trading crypto assets comes with a risk of financial loss.




