
 Injective
 Bitcoin
 Quantus
 Sui
Sui Derive
 Pump.fun
 Quant
Quant
- The ABNB stock price is currently trading at $136.56 while taking support from the 50-day EMA.
- After falling nearly -13.67%, the bulls have created a bullish momentum to cover their resistance.
Airbnb Inc (ABNB) was founded in August 2008. It is an San Francisco-based company that offers short and long term homestays and experiences by operating an online marketplace. The company acts as a broker and charges a commission from each booking.
The Current Performance of the ABNB Stock
The ABNB stock price declined by -2.79% during the intraday trading session. The stock price is trading at $136.56 level, with the current share volume at 29,486. It has a previous day’s closing price at $137.21 with the high Price-to-earning (P/E) ratio of 39.81. The ABNB stock holds a total market capitalization of $85,926,902,148 and has the average trading volume at 6,906,369.
Technical Analysis and Price Prediction of the ABNB Stock
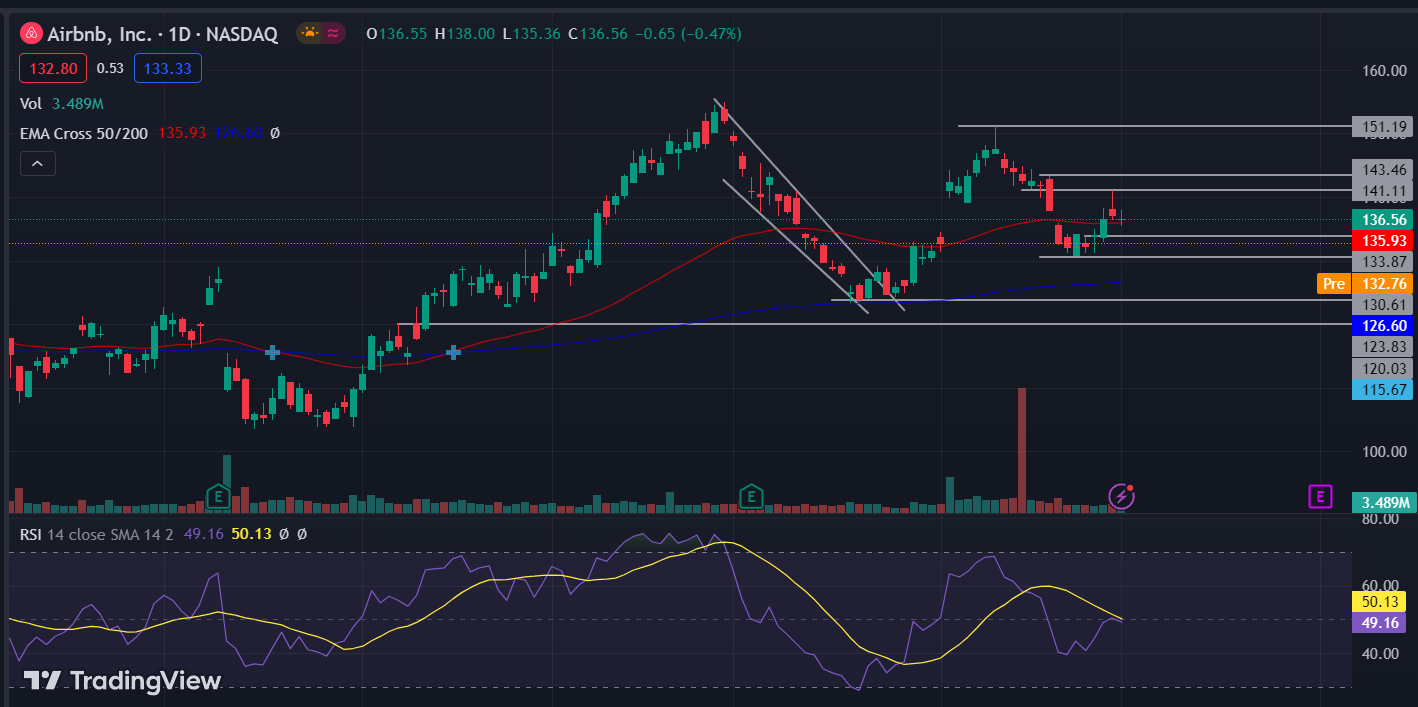
The stock price is trading above its 200-day EMA and 50-day EMA since the last bullish crossover of the 50-day EMA. After falling nearly -13.67%, the bulls have created a bullish momentum from $130.61 support level. The price has recently taken a support from the 50-day EMA and is currently performing in an uptrend.
At present, the ABNB stock price is trading at $136.56 level after taking an immediate support from $130.61. The price has formed a shooting star candle on the supply zone. It is basically a reversal sign candle at $141.11, which shows the bearish sentiments of the sellers.
Furthermore, The Relative strength index (RSI) trades at 49.16, which is retesting the 50 mark middle band.The RSI indicator showing clear view by sloping in correlation with the price chart without divergence. At present, the bulls are pushing the price upward by creating the momentum.
Conclusion
The ABNB stock price is trading in a bullish price structure. The price recently faced a resistance from $141.11 level by forming a shooting star bearish candle. So, if the price breaks above $143.46 level, it may rise to near its next level at $151.19. However , after giving respect to the recent resistance level, if the stock price closes below $130.61, it may probably drop to its short term demand zone at $123.83.
Technical levels
- Resistance Levels: $141.11 and $151.19
- Support Levels: $130.61 and $123.83
Disclaimer
The views and opinions stated by the author, or any person named in this article, are for informational purposes only. They do not establish financial, investment or any other advice. Investing in or trading stocks comes with risk of financial loss.




