
 Injective
 Bitcoin
 Quantus
 Sui
Sui Derive
 Pump.fun
 Quant
Quant
- During the weekly trading session, the DYDX crypto price dropped 11.01%.
- Moving averages indicate a strong bearish signal in the current trading phase.
- 24-hour trading volume has reached $6.01 million with an increment of 41.7%.
Built using the Cosmos SDK, dYdX (DYDX) is an open-source blockchain network that uses a proof-of-stake (PoS) consensus mechanism. Users can use the DYDX token to run the validator and participate in securing and governing the dYdX Chain network.
After performing with strong bullish sentiments in Feb and Mar 2024, the DYDX token price finally showed a strong selling period in Apr 2024. The price recorded over 40% drop during the April sell period and sustains above the bullish demand zone in the current month.
The DYDX Crypto Sustains Above the $1.61 Bullish POI
dYdX crypto showed a tremendous upsurge in price from November 8, 2024, resulting in an over 75% rise. The situation became intriguing for short-term traders and crypto cruisers. They placed their positions on the $2.28 decisional demand zone on January 8, 2024, and surged the crypto price above 90%.
DYDX price reached the $4.53 resistance level and fell below the $2.28 demand zone. The breakdown of that demand zone brought uncertainty in the direction that the price is facing right now. Compared to similar cryptocurrencies and the global cryptocurrency market, the dYdX price is underperforming in the current phase.
The initial distribution of the dYdX (DYDX) tokens is widely divided into various categories, as follows:
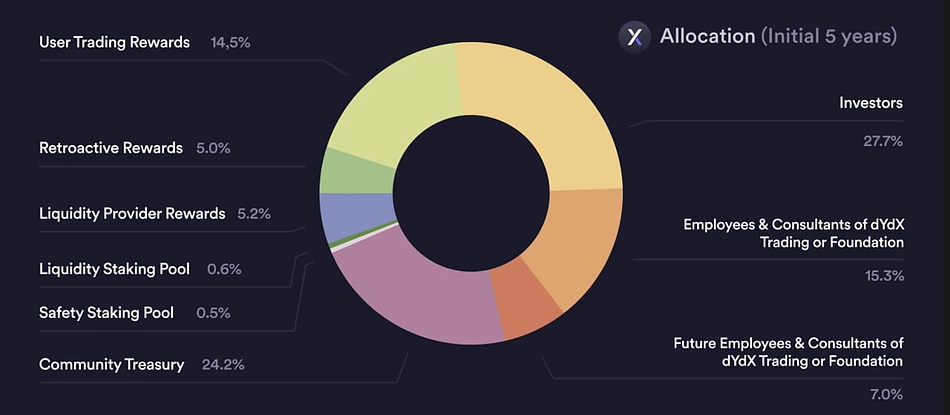
- 27.7% is allocated to the Investors.
- 14.5% is allocated to the User Trading Rewards.
- 15.3% is allocated to the Employees and Consultants of dYdX Trading or Foundation.
- 5.0% is allocated to the Retroactive Rewards.
- 5.2% is allocated to the Liquidity Provider Rewards.
- 7.0% is allocated to the Future Employees & Consultants of dYdX.
- 24.2% is allocated to the Community Treasury.
- 0.6% is allocated to the Liquidity Staking Pool.
- 0.5% is allocated to the Safety Staking Pool.
Technical Analysis of the dYdX (DYDX/USD)
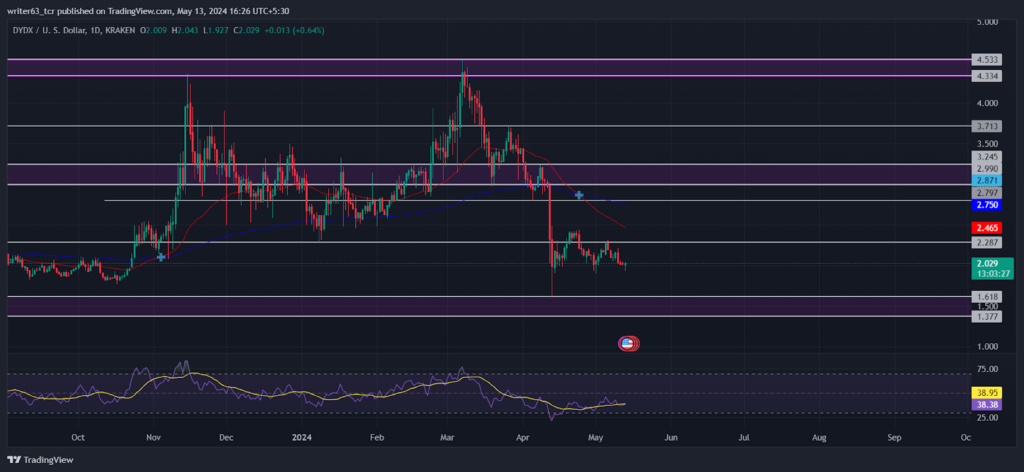
The current crypto price has slipped below the key exponential moving averages, reflecting bearish sentiments in technical terms. The 50-day and 200-day EMAs also had a death crossover, which is boosting bearish sentiments.
DYDX price faced strong resistance from the $4.53 level and fell below the $2.99 bullish POI. The price reflected an almost 44% decline to the $1.61 major demand zone. It shows some initial buying positions of the traders at the current phase. However, the current bullish strength seems weak enough to continue the uptrend.
The relative strength index (RSI) shows an internal bullish divergence in price momentum. The RSI line is moving at 37.99 below the SMA line while having a golden crossover, indicating weakness in strength and momentum.
Summary
DYDX crypto has witnessed a massive fall in price after reaching the $4.53 resistance level on March 8, 2024. The cryptocurrency has recorded over 60% adverse rally to the $1.61 demand zone. At present, the crypto has gotten some bullish remarks from that level, but more is still needed for the DYDX price to regain bullish momentum.
Technical Levels
When writing, the short-term immediate support for the DYDX price was $1.37, while the $3.24 level was the next resistance. The breakout or breakdown of any of those levels can lead the crypto price to further low or high levels in accordance with the direction.
Disclaimer
The views and opinions stated by the author or any people named in this article are for informational purposes only. They do not establish financial, investment, or any other advice. Investing in or trading crypto or stock comes with a risk of financial loss.




