
 Quantus
 Injective
 NEAR Protocol
 Sei
Sei Derive
 Bitcoin
 Zcash
Zcash
- The TRU crypto open interest has witnessed a massive surge.
- The TrueFi price has advanced by 90.6% in the last month.
TrueFi is an ERC-20 token used for governance and staking on the TrueFi Defi platform, which offers uncollateralized loans based on borrower trustworthiness.
TRU holders can vote on proposals, stake tokens for rewards and borrower trust, and influence interest rates.
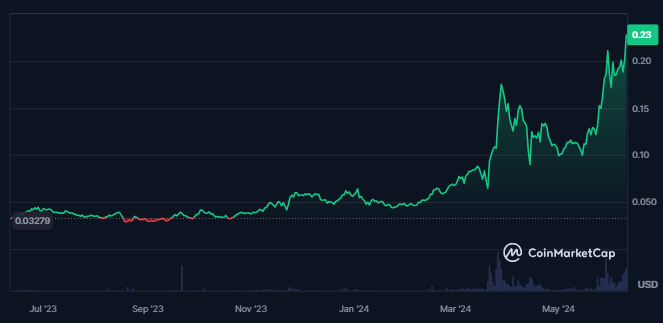
TrueFi crypto has 78.75% of its maximum supply in circulation, followed by a total supply of 1.198B TRU. The crypto price has advanced by 780% from its all-time low price of $0.02669.
The spot trading volume of the TrueFi crypto has advanced by 57%, resulting in a traded volume of $110.866M. Being a stablecoin, the crypto’s market cap ranking is #251 per CoinMarketCap.
It has a market cap of $259.248M, and the market cap dominance of the crypto is very low, resulting in 0.01%. The Supply inflation of the TrueFi crypto is also high, followed by a huge price volatility of 23.62%.
TrueFi Crypto Derivatives Analysis Overview
A massive addition to the open positions of the TrueFi crypto can be seen over the last 24 hours, followed by a surge of 78% in its trading volume.
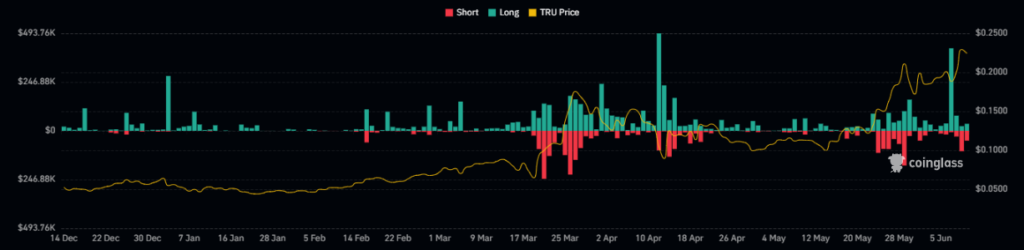
The liquidation chart of Coinglass shows higher longs liquidated over the last few months, followed by very few shorts liquidated.
The derivatives trading volume for the crypto has advanced by 48% in the last 24 hours from the spot time, resulting in a value of $261.39M. Also, the recorded short liquidation for the crypto in the previous 24 hours is worth $146.03K.
Moreover, the current Total Value Locked for the crypto is $23.6K, followed by a total liquidity of $1.58M.
TRU Crypto Technical Analysis
The price of the TRU crypto broke above solid resistance levels, followed by a break of structure to bullish, which shows that the crypto trend is bullish.
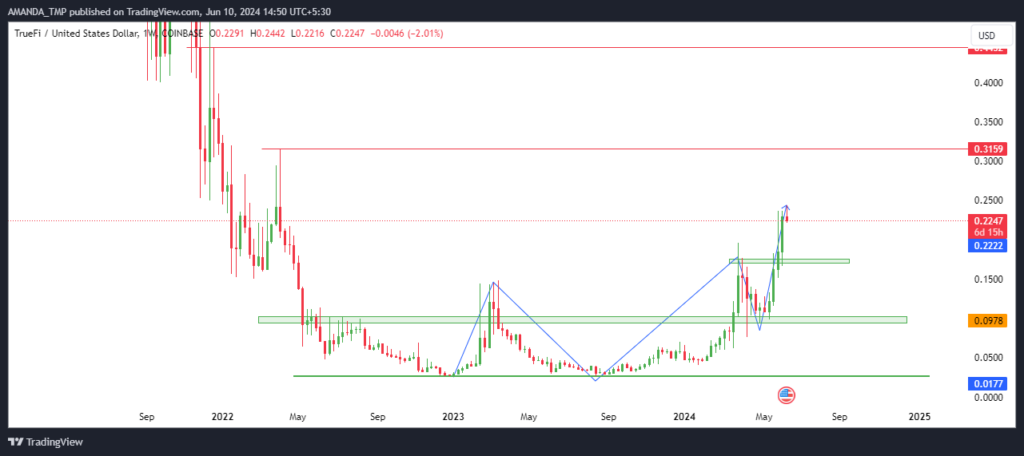
The price of the TRU crypto follows a strong uptrend, followed by consistently formed higher high swings on the chart. Also, the crypto price broke above the long-term resistances, which demands looking at higher timeframes on the chart.
The present scenario on the charts shows strong bullish candles followed by a consistent rise in the trading price. It shows the dominance of bulls and a higher probability of a further surge in the price.
TRU/USD Chart by TradingView
The price of the TRU crypto can be seen advancing to higher levels by taking support at the 50-day EMA. Moreover, at press time, the price of the crypto is trading 128% above the 50-day EMA. It shows a substantial deviation between the price and the EMA.
The MACD also gives a strong buy signal as the MACD and the signal line are trading above the zero level and have formed bullish histograms on the chart.
The RSI is following a bullish cycle and has broken above the 14-day SMA and sustained above the same. It has also crossed above the 70 level, showing strength in the momentum of the price.
Summary
TrueFi (TRU) has surged 90.6% in the last month and 780% from its all-time low, indicating strong bullish momentum.
Technical indicators such as MACD and RSI show buy signals, while the price trades significantly above the 50-day EMA. High trading volume and open interest further support a bullish outlook.
The support levels for the TRU crypto are $0.0250 and $0.100, while the resistance levels for the crypto are $0.310 and $0.440.
Disclaimer
This article is for informational purposes only and does not provide any financial, investment, or other advice. The author or any people mentioned in this article are not responsible for any financial loss that may occur from investing in or trading. Please do your research before making any financial decisions.




